Answered step by step
Verified Expert Solution
Question
1 Approved Answer
I only need help on the ratio formulas sheet all the info is attached Community Hospital Statement of Financial Position As of December 31, 2018
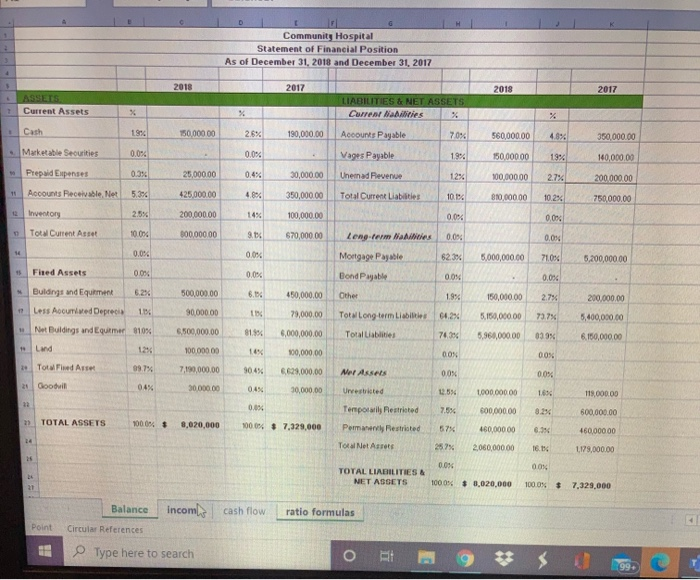
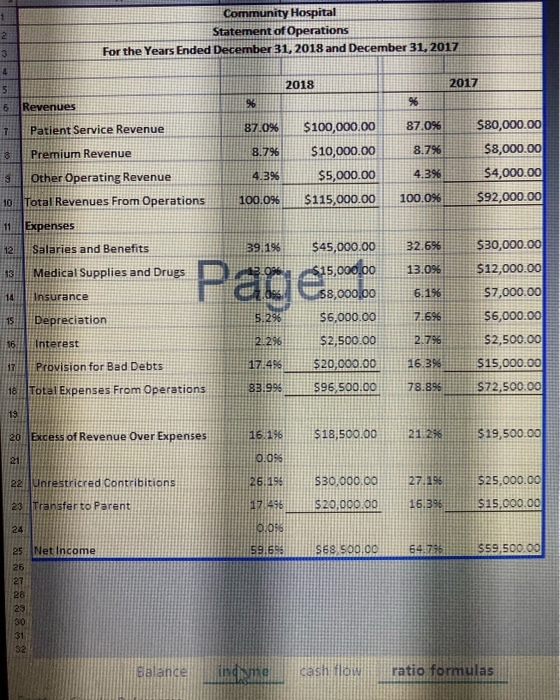
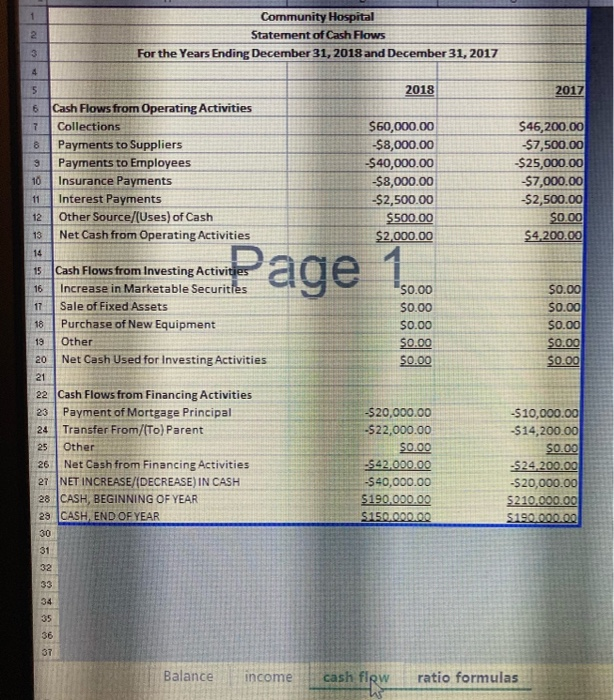
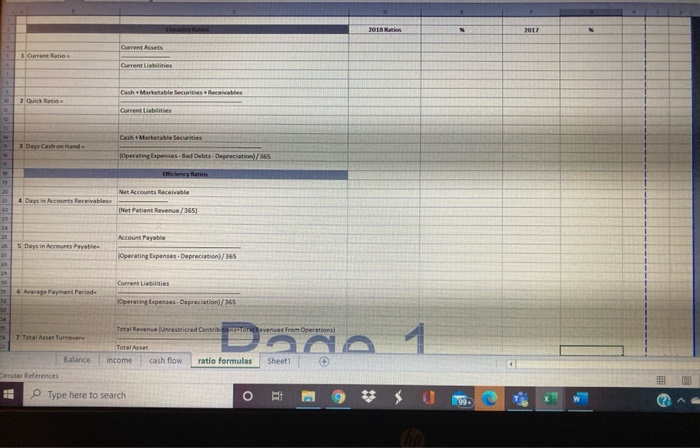
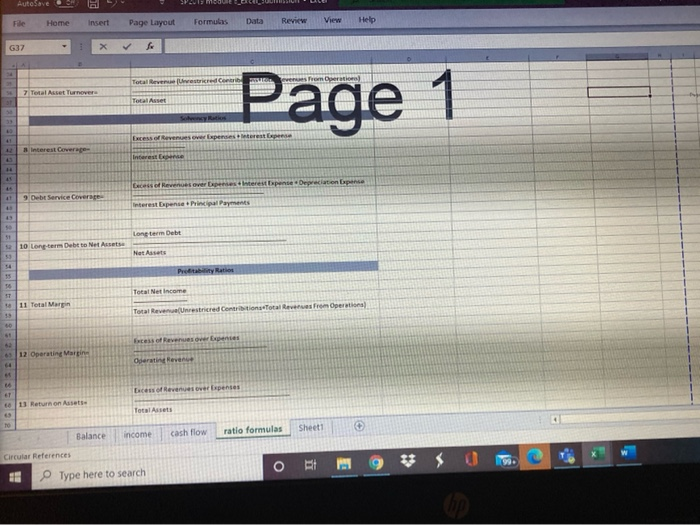
I only need help on the ratio formulas sheet all the info is attached
Community Hospital Statement of Financial Position As of December 31, 2018 and December 31, 2017 2018 2017 2018 2017 ASSETS Current Assets % LIABILITIES & NET ASSETS Current Mailities % % Cash 18% 150,000.00 2.6% 190,000.00 Accounts Payable 70% 560,000.00 350,000.00 Marketable Securities 0.0% 0.0% Vages Payable 19% 150,000.00 19% 140,000.00 Prepaid Expenses 0.3% 25,000.00 0.4% 30,000.00 Une nad Revenue 12% 100,000.00 2.7% 200.000.00 11 Accounts Receivable Net 5.3% 425,000.00 350,000.00 Total Current Liabilities 10.14 810,000.00 10.2% 750,000.00 Inventory 2.5% 200,000.00 14% 100,000.00 0.0% 0.0% Tots Current Asset 100% 800,000.00 8.16 670,000.00 Long-term Waits 0,05 0.0% 14 0.0% 0.0% Mortgage Payable 62.3% 5,000,000.00 71.0% 5,200,000.00 15 Fixed Assets 0.0% 0.0% Bond Payable 0.0% 0.0% Buldings and Equimen 500,000.00 6.154 450,000.00 Other 1.9% 150,000.00 2.7% 200,000.00 17 Less Accurised Deprecis 10. 90,000.00 64.2% 5,150,000.00 73.7% 5,400,000.00 79,000.00 6,000,000.00 Net Buldings and Equmer 810% Total Long term Liabilities Total Liabilities 1 6,500,000.00 81.35 5,960,000.00 039% 6.150,000.00 18 Land 74.3% 0.0% 10000000 tes 300,000.00 00% 2. Tota Fised Are 99.7% 7,190,000.00 30.4% 6.629,000.00 Met Assets 0.0% 0.0% 20 Goodwill 0.4% 30.000.00 0.4% 30,000.00 Urrestricted 12.5% 1636 119.000.00 1.000.000.00 600,000.00 0.0% 600,000.00 20 TOTAL ASSETS 10005 Temporarily Restricted Permany Restricted 8,020,000 100.0% 57.329,000 57% 6.9% 460,000.00 460,000.00 2,060,000.00 TotNet Assets 257% 1,173,000.00 25 0.0% 00% TOTAL LIABILITIES & NET ABGETS 100.0% $ 8,020,000 100.0% $ 7,329.000 Balance incom cash flow ratio formulas Point Circular References Type here to search 99 2 3 4 Community Hospital Statement of Operations For the Years Ended December 31, 2018 and December 31, 2017 2018 2017 5 6 % Revenues 96 Patient Service Revenue T 8740% 87.096 8 Premium Revenue 8.796 8.7% $100,000.00 $10,000.00 $5,000.00 $115,000.00 $80,000.00 $8,000.00 $4,000.00 $92,000.00 4.39 4.3% 9 Other Operating Revenue 10 Total Revenues From Operations 11 Expenses 100.096 100.096 112 Salaries and Benefits 39.196 32.696 $30,000.00 $45,000.00 $15,000.00 13 Medical Supplies and Drugs 13.096 $12,000.00 Page 14 Insurance $8,000.00 6.196 $7,000.00 $6,000.00 15 Depreciation 5.296 7.696 16 Interest 2.1296 2.796 $2,500.00 $6,000.00 $2,500.00 $20,000.00 596,500.00 17 Provision for Bad Debts 17.496 16.39 $15,000.00 $72,500.00 18 Total Expenses From Operations 83.996 78.896 19 20 Excess of Revenue Over Expenses 16.196 $18,500.00 21 246 $19,500.00 21 0.056 22 Unrestricred Contribitions 26.196 27.196 $25,000.00 $30,000.00 $20,000.00 23. Transfer to Parent 12.496 16.39 $15,000.00 24 0.016 59.69 SES, SO0.00 64.736 $59,500.00 25 Net Income 26 27 28 30 32 Balance ingine cash flow ratio formulas 2 Community Hospital Statement of Cash Flows For the Years Ending December 31, 2018 and December 31, 2017 4 5 2018 2017 7 $60,000.00 -$8,000.00 -540,000.00 $8,000.00 -$2,500.00 $500.00 $2,000.00 $46,200.00 $7,500.00 -$25,000.00 $7,000.00 $2,500.00 $0.00 $4,200.00 13 15 Page 1 16 6 Cash Flows from Operating Activities Collections Payments to Suppliers 9 Payments to Employees 10 Insurance Payments 11 Interest Payments 12 Other Source/(Uses) of Cash Net Cash from Operating Activities 14 Cash Flows from Investing Activities Increase in Marketable Securitie 17 Sale of Fixed Assets 18 Purchase of New Equipment 19 Other 20 Net Cash Used for Investing Activities 21 22 Cash Flows from Financing Activities 23 Payment of Mortgage Principal 24 Transfer From/(To) Parent 25 Other 26 Net Cash from Financing Activities 27 NET INCREASE/DECREASE) IN CASH 28 CASH, BEGINNING OF YEAR 29 CASH, END OF YEAR 30 $0.00 $0.00 $0.00 $0.00 $0.00 $0.00 $0.00 $0.00 $0.00 $0.00 -$20,000.00 -522,000.00 $0.00 -542,000.00 S40,000.00 $190,000.00 S150,000.00 -$10,000.00 -$14,200.00 $0.00 -524,200.00 -$20,000.00 $210,000.00 $190.000,00 31 32 33 34 35 36 37 Balance income cash flow ratio formulas 2018 Ratio 2017 Current Assets 1 Current Ratio Current titties CashMarketable Securities + Receivables 2 Quick Ratio Current Liabilities Cash+Marketable Securities 3 Days Cash on Hand Operating Expenses - Bad Debts-Depreciation/365 thiency Ratios Net Accounts Receivable 4 Days in Accounts Receivables 22 Net Patient Revenue/365) Account Payable 5 Days in Accounts Payable Operating penses-Depreciation)/365 2 Current Liabilities 6 Ararape Payment Period Operating Expenses-Depreciation/365 Total Revenue Unrestricred Contri Ovenues from Operations 7 Total Asset Turnovere Dana 1 Total Asset Balance income cash flow ratio formulas Sheet1 Circular References Type here to search o E 2 AutoSave File Home Insert Page Layout Formules Data Review View Help G37 Total Revenue Usted on 7 Total Asset Turnover Total Asset Page 1 41 Excess of Revenues over Expenses restepense B Interest Coverage Interesten 1 Gecessf Revenues over pees Interests pense Depreciation pense 41 9 Debt Service Cover Interest Depende Principal Payments 51 Long term Debt 10 Long-term Debt to Net Assets Not Assets 4 Total Net income 18 99 11 Total Margin Total Revenue(Unrestricred Contributions Total Reveres from Operational Excess of Reverse Expenses 12 Operating Marine Operating Reven te of Revel over Expenses ET Return on Assets Total Assets TO Sheet1 cash flow ratio formulas Balance income Circular References Type here to search O Step by Step Solution
There are 3 Steps involved in it
Step: 1

Get Instant Access to Expert-Tailored Solutions
See step-by-step solutions with expert insights and AI powered tools for academic success
Step: 2

Step: 3

Ace Your Homework with AI
Get the answers you need in no time with our AI-driven, step-by-step assistance
Get Started


