I only need Part 3. Code in Matlab please. 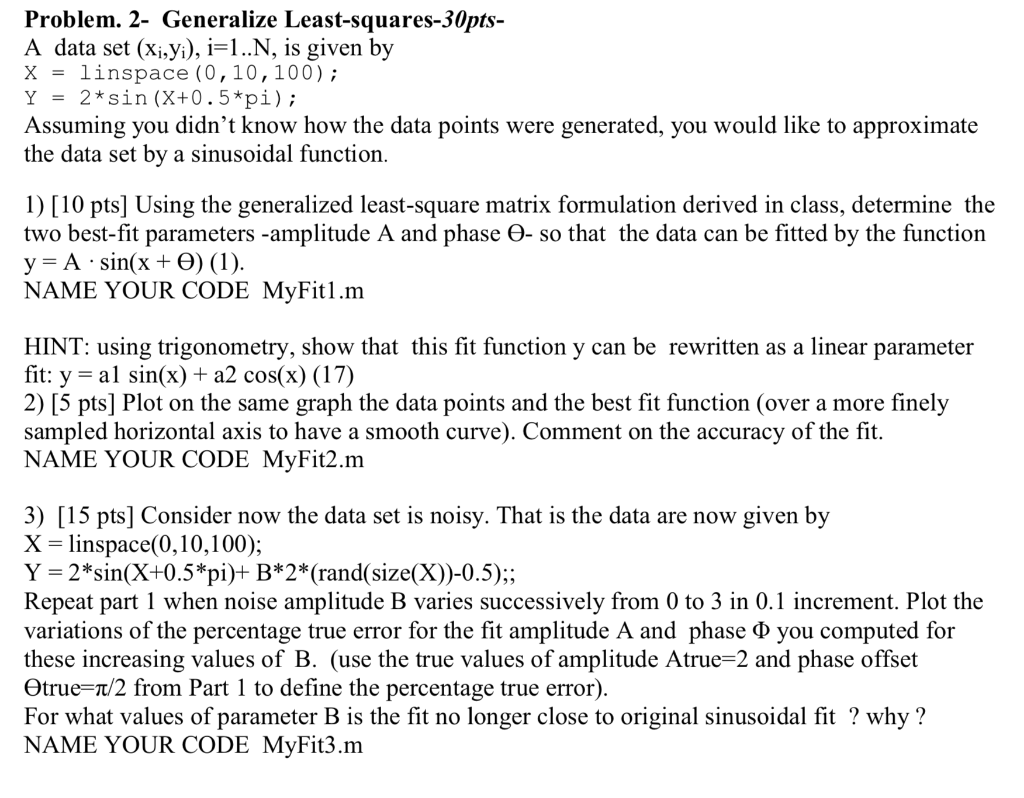
Problem. 2- Generalize Least-squares-30pts- A data set (xi.yi), i-1..N, is given by X - linspace (0,10,100) Y 2*sin (X+0.5*pi); Assuming you didn't know how the data points were generated, you would like to approximate the data set by a sinusoidal function 1) [10 pts] Using the generalized least-square matrix formulation derived in class, determine the two best-fit parameters-amplitude A and phase -so that the data can be fitted by the function y-A . sin(x + )( 1 ) NAME YOUR CODE MyFitl.m HINT: using trigonometry, show that this fit function y can be rewritten as a linear parameter fit: y-al sin(x) + a2 cos(x) (17) 2) [5 pts] Plot on the same graph the data points and the best fit function (over a more finel;y sampled horizontal axis to have a smooth curve). Comment on the accuracy of the fit. NAME YOUR CODE MyFit2.m 3) [15 pts] Consider now the data set is noisy. That is the data are now given by X = linspace(0, 10, 1 00); Y = 2*sin(X+0.5*pi)+ B*2*(rand(size(X))-0.5); Repeat part 1 when noise amplitude B varies successively from 0 to 3 in 0.1 increment. Plot the variations of the percentage true error for the fit amplitude A and phase you computed for these increasing values of B. (use the true values of amplitude Atrue-2 and phase offset Otrue-m/2 from Part 1 to define the percentage true error) For what values of parameter B is the fit no longer close to original sinusoidal fit ? why? NAME YOUR CODE MyFit3.m Problem. 2- Generalize Least-squares-30pts- A data set (xi.yi), i-1..N, is given by X - linspace (0,10,100) Y 2*sin (X+0.5*pi); Assuming you didn't know how the data points were generated, you would like to approximate the data set by a sinusoidal function 1) [10 pts] Using the generalized least-square matrix formulation derived in class, determine the two best-fit parameters-amplitude A and phase -so that the data can be fitted by the function y-A . sin(x + )( 1 ) NAME YOUR CODE MyFitl.m HINT: using trigonometry, show that this fit function y can be rewritten as a linear parameter fit: y-al sin(x) + a2 cos(x) (17) 2) [5 pts] Plot on the same graph the data points and the best fit function (over a more finel;y sampled horizontal axis to have a smooth curve). Comment on the accuracy of the fit. NAME YOUR CODE MyFit2.m 3) [15 pts] Consider now the data set is noisy. That is the data are now given by X = linspace(0, 10, 1 00); Y = 2*sin(X+0.5*pi)+ B*2*(rand(size(X))-0.5); Repeat part 1 when noise amplitude B varies successively from 0 to 3 in 0.1 increment. Plot the variations of the percentage true error for the fit amplitude A and phase you computed for these increasing values of B. (use the true values of amplitude Atrue-2 and phase offset Otrue-m/2 from Part 1 to define the percentage true error) For what values of parameter B is the fit no longer close to original sinusoidal fit ? why? NAME YOUR CODE MyFit3.m