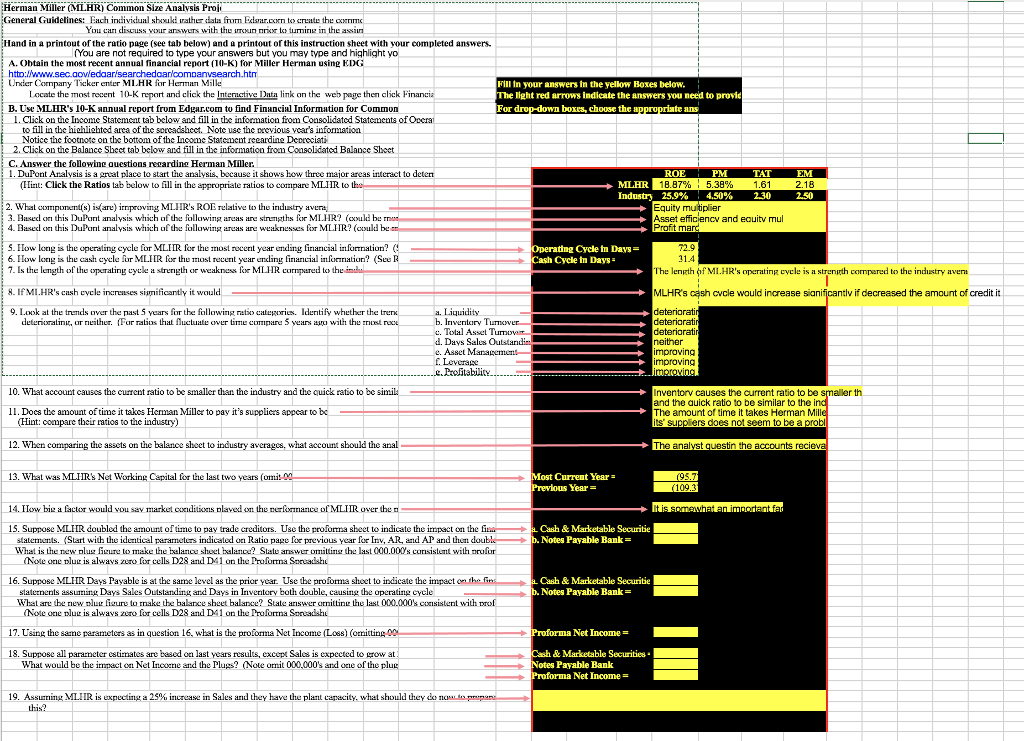
 I posted all the information you need. The last few questions I'm very confused on, please help!
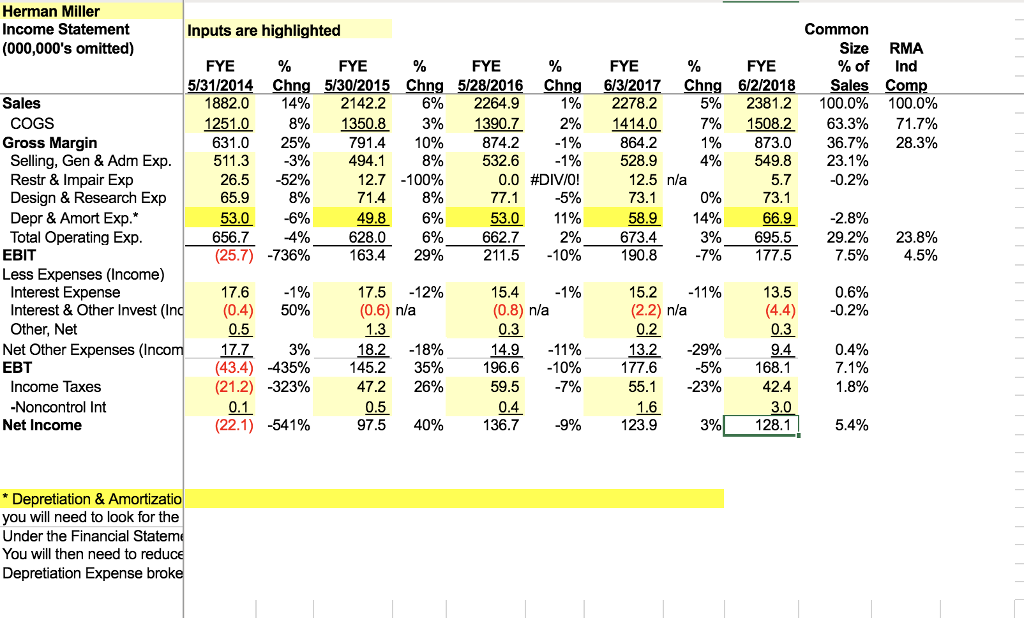
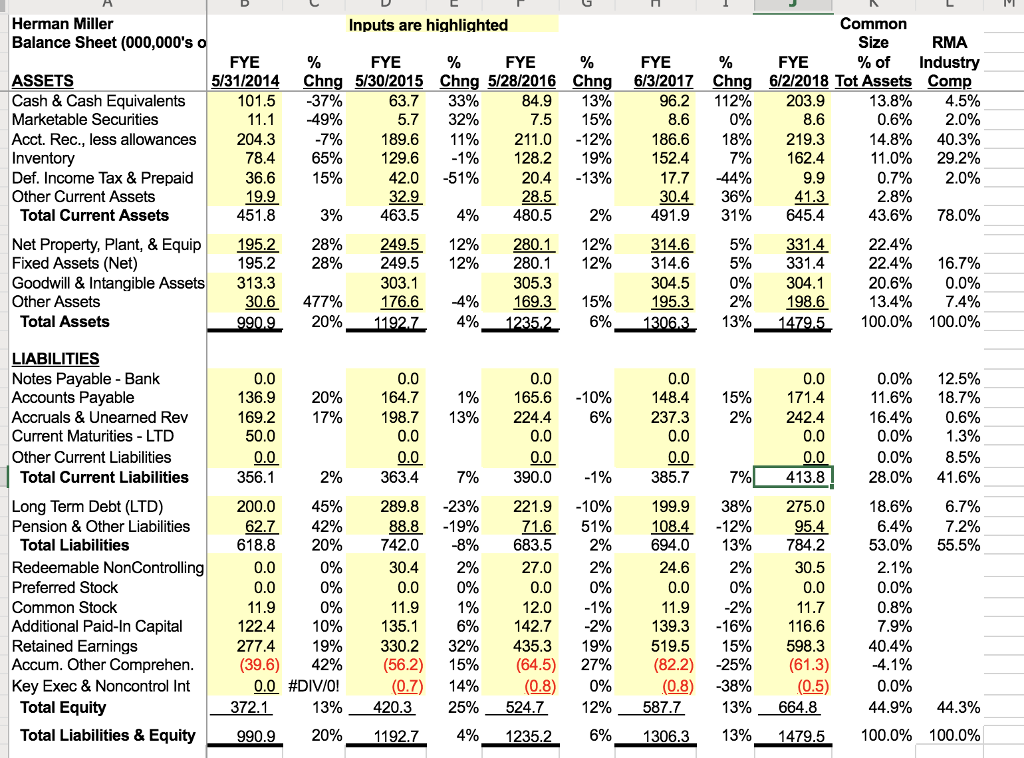
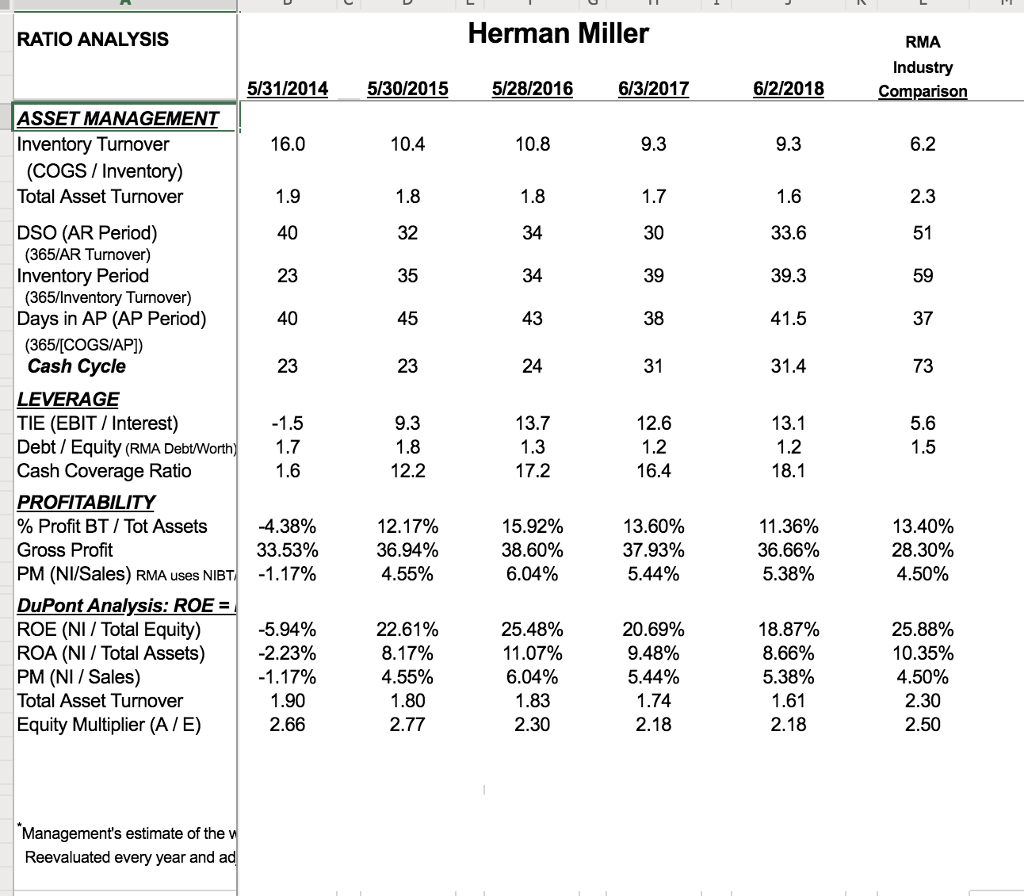
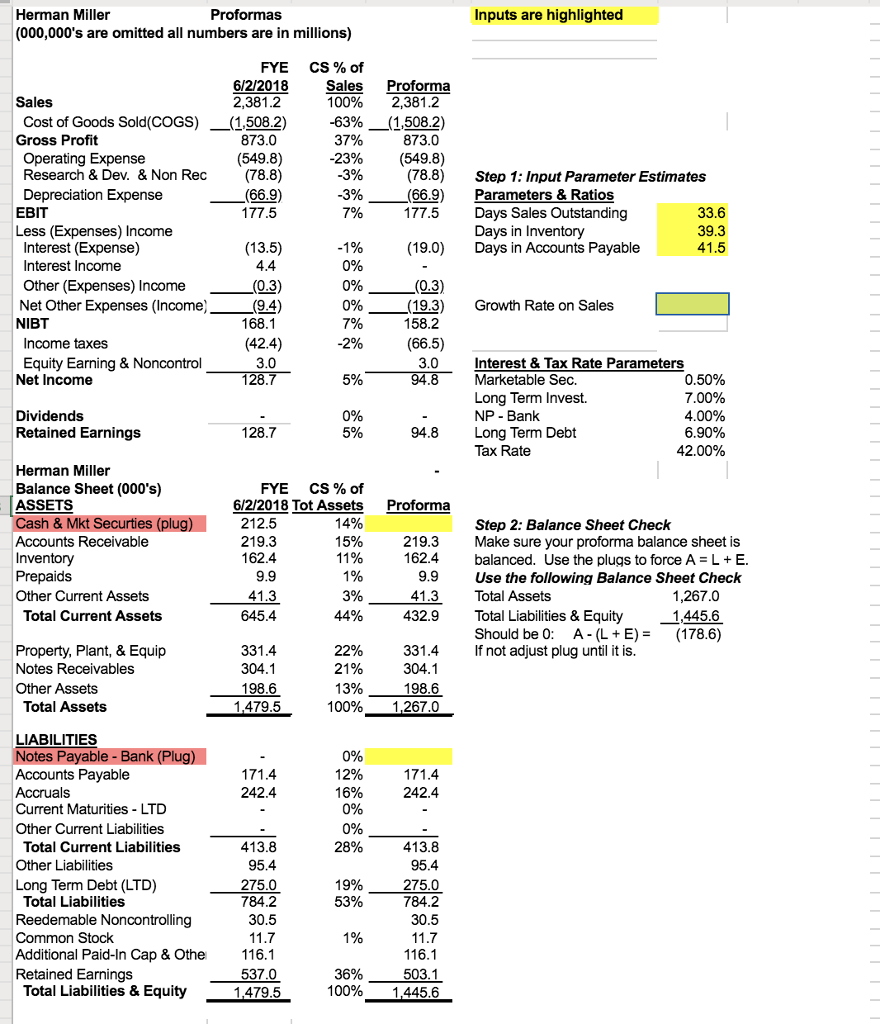
Herman Miller Income Statement (000,000's omitted) Inputs are highlighted Commorn Size RMA %of Ind 5/31/2014 Chng5/30/2015 Chng 5/28/2016 Chng 6/3/2017 Chng 6/2/2018 Sales Comp FYE FYE FYE FYE FYE Sales 1882.0 14% 2142.2 6% 2264.9 1251.0 8% 1350.8 3% 13907 2% 14140 7% 15082 63.3% 71.7% 1% 2278.2 5% 2381.2 100.0% 100.0% COGS Gross Margin 631.0 25% 791.4 10% 874.2-1% 864.2 528.9 1% 873.0 36.7% 28.3% 51 1.3-3% 26.5-52% 65.9 8% 53.0-6% 656.7-4% 494.1 8% 12.7-100% 71.4 8% 49.8 6% 628.0 6% 532.6-1% 0.0 #DIV/0! 77.1-5% 53.0 11% 2% 4% 0% 3% 549.8 23.1% 5.7-0.2% Selling, Gen & Adm Exp Restr & Impair Exp Design & Research Exp Depr & Amort Exp.* Total Operating Exp 12.5 nla 73.1 58.9 14% 66.9 -2.8% 73.1 673.4 695.5 (25.7)-736% 163.4 29% 211.5-10% 190.8-7% 177.5 662.7 29.2% 7.5% 23.8% 4.5% EBIT Less Expenses (Income) 17.5-12% Interest Expense Interest & Other Invest (In Other, Net 17.6-1% (0.4) 50% 15.4-1% (0.8) nla 0.3 14.9.11% 15.2-11% (2.2) n/a 0.2 13.2.29% 13.5 0.6% -0.2% (0.6) n/a 18.2.18% 47.2 (4.4) Net Other Expenses (Inco EBT 17.7 (43.4) (21.2) 0.1 (22.1) 3% -435% -323% 9.4 168.1 42.4 3.0 3% 128.1 0.4% 7.1% 1.8% 145.2 35% 26% 196.6-10% 177.6-5% 59.5-7% Income Taxes Noncontrol Int 55.1-23% 0.5 97.5 40% 0.4 1.6 Net Income -541% 136.7 9% 123.9 5.4% *Depretiation & Amortizatio you will need to look for the Under the Financial State You will then need to redu Depretiation Expense broke Common Herman Miller Balance Sheet (000,000's Inputs are highlighted RMA FYE FYE % of Industry ASSETS Cash & Cash Equivalents Marketable Securities Acct. Rec., less allowances Inventory Def. Income Tax & Prepaid Other Current Assets 5/31/2014 Chng 5/30/2015 Chng 5/28/2016 Chng 6/3/2017Chng 6/2/2018 Tot Assets Comp 101.5-37% 63.7 33% 5.7 32% 96.2 112% 203.9 13.8% 06% 14.8% 11.0% 0.7% 4.5% 20% 40.3% 29.2% 2.0% 11.1-49% -7% 189.6 11% 211.0-12% 186.6 18% 219.3 7% 162.4 78.4 65% 129.6-1% 128.2 19% 152.4 28 42.0-51% 17.7-44% 30.4 36% 20.4-13% 451.8 195.2 313.3 Total Current Assets 3% 463.5 4% 480.5 2% 491.9 31% 645.4 436% 780% Net Property, Plant, & Equip Fixed Assets (Net) Goodwill & Intangible Assets Other Assets 314.6 195.2 28% 249.5 12% 280.1 12% 314.6 304.5 15% 195.3 28% 249.5 12% 280.1 12% 5% 5% 0% 2% 13%-1479.5" 331.4 331.4 304.1 198.6 22.4% 22.4% 20.6% 13.4% 100.0% 16.7% 0.0% 7.4% 100.0% 303.1 477% 176.6 30.6 -4% 169.3 4%-12352 Total Assets 20%-1192.7. 6%-1306. LIABILITIES Notes Payable Bank Accounts Payable Accruals & Unearned Rev Current Maturities LTD Other Current Liabilities 0.0% 11.6% 16.4% 0.0% 0.0% 28.0% 18.6% 6,4% 530% 12.5% 18.7% 0.6% 1.3% 8.5% 41.6% 6.7% 72% 555% 136.9 20% 164.7 1% 165.6-10% 169.2 17% 198.7 13% 224.4 6% 237.3 148.4 15% 171.4 2% 242.4 0.0 0.0 Total Current Liabilities 356.1 7%) 413.8 199.9 38% 275.0 88.8 -19% 71.651% 1084-12% 95.4 618.8 20% 742.0-8% 683.5 2% 694.0 13% 784.2 2% 363.4 7% 390.0-1% 385.7 Long Term Debt (LTD) Pension & Other Liabilities 200.0 45% 289.8-23% 221.9-10% 62.7 42% Total Liabilities Redeemable NonControlling Preferred Stock Common Stock Additional Paid-In Capital Retained Earnings Accum. Other Comprehen Key Exec & Noncontrol Int 27.0 12.0-1% 11.9-2% 122.4 10% 135.1 6% 142.7-2% 139.3-16% 116.6 277.4 19% 330.2 32% 435.3 19% 519.5 15% 598.3 (64.5) 40.4% -4.1% 42% 0.0 #DIV/0! 372.1 13% -20% (39.6) (56.2) (0.7) 15% 14% 25% 524.7 4%,-35-6%,-06: 27% 0% 12% (82.2) (0.8) -25% -38% 13% 13%, (61.3) (0.5) (0.8) Total Equity 420.3 587.7 664.8 44.9% 44.3% Total Liabilities & Equity -9 2.7. 100.0% 100.0% RATIO ANALYSIS Herman Miller RMA Industry Comparison 5/31/2014 5/30/2015 5/28/2016 6/3/2017 6/2/2018 ASSET MANAGEMENT Inventory Turnover 16.0 10.4 10.8 (COGS/Inventory) Total Asset Turnover 33.6 DSO (AR Period) (365/AR Turnover) Inventory Period (365/lnventory Turnover) Days in AP (AP Period) (365/[COGS/AP]) 32 35 45 23 51 59 37 73 34 30 39 38 31 23 34 39.3 Cash Cycle LEVERAGE TIE (EBIT / Interest) Debt / Equity (RMA DebtWorth Cash Coverage Ratio PROFITABILITY % Profit BT / Tot Assets Gross Profit PM (NI/Sales) RMA uses NBT DuPont Analysis: ROE- ROE (NI / Total Equity) ROA (NI / Total Assets) PM (NI / Sales) Total Asset Turnover Equity Multiplier (A/E) 13.7 12.6 12.2 17.2 16.4 4.38% 3355% -1.17% 12.17% 36.94% 45 % 15.92% 38.60% 6.04% 13.60% 37.93% 5.44% 11.36% 36.66% 538% 13.40% 28.30% 45% 20.69% 9.48% 5.44% 1.74 25.88% 10.35% 22.61% 8.17% 45 % 1.80 2.77 -5.94% -2.23% 25.48% 11 .07% 6.04% 1.83 2.30 18.87% 539% 2.18 1.90 2.66 2.30 2.50 Management's estimate of the Reevaluated every year and ad Herman Miller (000,000's are omitted all numbers are in millions) Proformas Inputs are highlighted FYE 6/2/2018 CS % of Sales Proforma 100% 2,381.2 -63%-(1,508.2) 873.0 (549.8) (78.8) Sales 2,381.2 Cost of Goods Sold(COGS) -(1,508.2) Gross Profit Operating Expense Research & Dev. &Non Rec Depreciation Expense (78.8) (66.9) -3% -3% Step 1: Input Parameter Estimates 66.9)Parameters & Ratios EBIT Less (Expenses) Income 177.5 Days Sales Outstanding Days in Inventory Days in Accounts Payable Interest (Expense) (19.0) Interest Income Other (Expenses) Income Net Other Expenses (Income) NIBT 3) 4) (0.3) (19.3) 158.2 0% Growth Rate on Sales Income taxes Equity Earning & Noncontrol Net Income Interest & Tax Rate Parameters Marketable Sec. Long Term Invest. 7.00% Dividends Retained Earnings Long Term Debt Tax Rate 6.90% 42.00% 128.7 94.8 Herman Miller Balance Sheet (000's) ASSETS Cash & Mkt Securties (plug) Accounts Receivable Inventory Prepaids Other Current Assets CS % of 6/2/2018 Tot Assets FYE 212.5 162.4 Proforma Step 2: Balance Sheet Check 15% 219.3 Make sure your proforma balance sheet is 162.4 balanced. Use the plugs to force A -LE. Use the following Balance Sheet Check Total Assets Total Liabilities & Equity -1445.6 Should be0: A- (L+E)(178.6) If not adjust plug until it is 1,267.0 Total Current Assets 645.4 44% Property, Plant, & Equip Notes Receivables Other Assets 432.9 331.4 198.6 Total Assets 100%, 26.0 LIABILITIES Notes Payable - Bank (Plug) Accounts Payable Accruals Current Maturities LTD Other Current Liabilities 242.4 242.4 413.8 Total Current Liabilities Other Liabilities Long Term Debt (LTD) 275.0 784.2 Total Liabilities Reedemable Noncontrolling Common Stock Additional Paid-In Cap & Othe Retained Earnings 784.2 55% 116.1 Total Liabilities & Equity 1,479.5 100% 1.446 Herman Miller MLHRI Common Size Analysis Proj General Guidelines: Each inivicdual shukthrdats from Esa the Ci You car discuss wour answurs with the rroun t tunirz in the assiun Hand in a printout of the ratio page (see tab below) and a printout of this instruction sheet with your completed answers. You are not required to type your answers but you may type and highlight yo A. Obtain the most recent annual financial report (10-K) for Miller Herman using KDG Uier Conpany Ticker enter MIHR for Herman Mille B. Use MLHR's 10-K annual report from Edgar.com to find Financial Information for Common Fill In your answers in the yellow Boxes below. The light red arrows indicate the answers you need to provid For drop-down boxes, choose thec appropriate ans Lacate the most recent 10-K report and click the Internstive Dntn link an the web page then click Finan .Click on the Incoe Statement tab below and fill in the information fiom Consolidated Statements of to fill in tbe hiohliohted arca of the sorcadshect. Note use the reevious vcar's information Noticc thec footnote on the bottom of the Income Stateneut reardin Deorciati 2. Click on the Balance Shect tab below and fill in the information from Consolidated Balancc Sheet alance Sheet tab bome Stateneyear's C. Answer the followine auestions recardine Herman Miller. 1. DuPont Analvsis is a great place to start the analysis, bocause it shows how three major areas interact to deten PM TAT EM (lint: Click the Ratios tab below to fill in the appropriate ratios to compare MLIIR to MLHR Indust 25.9% 4.50% 2.30 250 18.87% 5.38% 1.61 2.18 2. What component(s) dae) improving MLI IR's ROE relative to thus industry avera Equity mutiplier sset efficiency and equitv mul Profit mard Based this DuPont analysis which of the following areas are strngths for MLHR? (could be this DuPornt analysis which f the following aruas are weaknesses for MLIIR? (could be Based S. Iow long is the operating cycle fr MLIIR for the most recent year ending financial informatiun? ( 6. low long is the cashcycle fr MLIIR for th ms recernt year ending firnarcia information? Se R 7. Is the length of the peraling yka strerngth or weakness for MIHR cornpared to th Operating Cycle Cash Cycle in Days in Days- 31.4 l'he length f Ml.HR's mperating cycle is a strenrth compared to the industry aven. 8. If MLHR'scash ele increases sismificantly it would 9. 1.ook at the trends ver theast 5 Years for the following rato categories. Identify whether the MLHRs cash cvcle would increase siani if decreased the amount of credit it a. Liquidi b. Inventry Turnver e. Total AssetT d. Days Sales Outstandi e. Asset Manapement deteriorat deterioratin, or rneither. For ratius that fAuctuate over tim cumipare 5 years a with the est deteriorat neither improving improving umovr e.roitabilite 10wiat account causes the current ratio to be smaller than the industry, and dic quick ratio to be simila Inventov causes the current ratio to be and the auick ratio to be similar to the i The amount of time it takes Herman Mill its' suppliers does not seem to be a pro maller th 11. Docs the amount of time it takes Herman Millcr to pay it's supplicrs appcar to Hint: copare their ratios to the industry) 12. When comparing the assets on the balance sheet to industry avcrages, what accoumt sbould the anal- The analyst questin the accounts reci What was MLTIR's Net Working Capital for the last two years ( Most Current Year Previous Year 109 1 14. Iow big a factor would vou say market cxiditions nlaved othenefoa ance of MLIIR over the 15. Suppose MLIIR doubled the amount of time to pay trade creditors. Use the proforma sheet to indicate the impact on theiL Cash& Marketable Securitie b Notes Payable Bank tatements. Start with the iderntical parameters indicated on Ratio page foe previous year for Inv, AR, and AP and then doub What is he new lus figure to make he belanco sheet balance? Slate answur umulting the last 000.000s cursslat with (Note one vluc is alwavs zcro for cells D28 and D41 on the Troforna Soreadsh Cash & Marketable Securitie b. Notes Payable Bank 16. Suppose MLIR Days Payable is at the same level as tke prior year. Use the proforma sheet to indicate the impact on the fin staternents assuning Days Sales Outstanding and Days in Inventory both double, causing the operating cyele What are the new nlur fiure to rnake the balance sheet balance? State answer onittin the last 000.000's coisistent with rof e one nlu is alwavs zuro for cells D28 and D41 on the Proformna 17. Using the same parameters as in question 16, what is the proforma Net Income (Loss) Proforma Net Income 18. Suppose all paraneter estirnates are based on last years results, except Sales is expected to grow at & Marketable Securities What would be the impact on Net Incone and the Plugs? Note onit 000,000's and one of the plug Notes Payable Bank 19. Assurrimg MI IR is uxpecting a 25% increase m Sales and they have the p ant capacity, what should hey do nuan opm on. Herman Miller Income Statement (000,000's omitted) Inputs are highlighted Commorn Size RMA %of Ind 5/31/2014 Chng5/30/2015 Chng 5/28/2016 Chng 6/3/2017 Chng 6/2/2018 Sales Comp FYE FYE FYE FYE FYE Sales 1882.0 14% 2142.2 6% 2264.9 1251.0 8% 1350.8 3% 13907 2% 14140 7% 15082 63.3% 71.7% 1% 2278.2 5% 2381.2 100.0% 100.0% COGS Gross Margin 631.0 25% 791.4 10% 874.2-1% 864.2 528.9 1% 873.0 36.7% 28.3% 51 1.3-3% 26.5-52% 65.9 8% 53.0-6% 656.7-4% 494.1 8% 12.7-100% 71.4 8% 49.8 6% 628.0 6% 532.6-1% 0.0 #DIV/0! 77.1-5% 53.0 11% 2% 4% 0% 3% 549.8 23.1% 5.7-0.2% Selling, Gen & Adm Exp Restr & Impair Exp Design & Research Exp Depr & Amort Exp.* Total Operating Exp 12.5 nla 73.1 58.9 14% 66.9 -2.8% 73.1 673.4 695.5 (25.7)-736% 163.4 29% 211.5-10% 190.8-7% 177.5 662.7 29.2% 7.5% 23.8% 4.5% EBIT Less Expenses (Income) 17.5-12% Interest Expense Interest & Other Invest (In Other, Net 17.6-1% (0.4) 50% 15.4-1% (0.8) nla 0.3 14.9.11% 15.2-11% (2.2) n/a 0.2 13.2.29% 13.5 0.6% -0.2% (0.6) n/a 18.2.18% 47.2 (4.4) Net Other Expenses (Inco EBT 17.7 (43.4) (21.2) 0.1 (22.1) 3% -435% -323% 9.4 168.1 42.4 3.0 3% 128.1 0.4% 7.1% 1.8% 145.2 35% 26% 196.6-10% 177.6-5% 59.5-7% Income Taxes Noncontrol Int 55.1-23% 0.5 97.5 40% 0.4 1.6 Net Income -541% 136.7 9% 123.9 5.4% *Depretiation & Amortizatio you will need to look for the Under the Financial State You will then need to redu Depretiation Expense broke Common Herman Miller Balance Sheet (000,000's Inputs are highlighted RMA FYE FYE % of Industry ASSETS Cash & Cash Equivalents Marketable Securities Acct. Rec., less allowances Inventory Def. Income Tax & Prepaid Other Current Assets 5/31/2014 Chng 5/30/2015 Chng 5/28/2016 Chng 6/3/2017Chng 6/2/2018 Tot Assets Comp 101.5-37% 63.7 33% 5.7 32% 96.2 112% 203.9 13.8% 06% 14.8% 11.0% 0.7% 4.5% 20% 40.3% 29.2% 2.0% 11.1-49% -7% 189.6 11% 211.0-12% 186.6 18% 219.3 7% 162.4 78.4 65% 129.6-1% 128.2 19% 152.4 28 42.0-51% 17.7-44% 30.4 36% 20.4-13% 451.8 195.2 313.3 Total Current Assets 3% 463.5 4% 480.5 2% 491.9 31% 645.4 436% 780% Net Property, Plant, & Equip Fixed Assets (Net) Goodwill & Intangible Assets Other Assets 314.6 195.2 28% 249.5 12% 280.1 12% 314.6 304.5 15% 195.3 28% 249.5 12% 280.1 12% 5% 5% 0% 2% 13%-1479.5" 331.4 331.4 304.1 198.6 22.4% 22.4% 20.6% 13.4% 100.0% 16.7% 0.0% 7.4% 100.0% 303.1 477% 176.6 30.6 -4% 169.3 4%-12352 Total Assets 20%-1192.7. 6%-1306. LIABILITIES Notes Payable Bank Accounts Payable Accruals & Unearned Rev Current Maturities LTD Other Current Liabilities 0.0% 11.6% 16.4% 0.0% 0.0% 28.0% 18.6% 6,4% 530% 12.5% 18.7% 0.6% 1.3% 8.5% 41.6% 6.7% 72% 555% 136.9 20% 164.7 1% 165.6-10% 169.2 17% 198.7 13% 224.4 6% 237.3 148.4 15% 171.4 2% 242.4 0.0 0.0 Total Current Liabilities 356.1 7%) 413.8 199.9 38% 275.0 88.8 -19% 71.651% 1084-12% 95.4 618.8 20% 742.0-8% 683.5 2% 694.0 13% 784.2 2% 363.4 7% 390.0-1% 385.7 Long Term Debt (LTD) Pension & Other Liabilities 200.0 45% 289.8-23% 221.9-10% 62.7 42% Total Liabilities Redeemable NonControlling Preferred Stock Common Stock Additional Paid-In Capital Retained Earnings Accum. Other Comprehen Key Exec & Noncontrol Int 27.0 12.0-1% 11.9-2% 122.4 10% 135.1 6% 142.7-2% 139.3-16% 116.6 277.4 19% 330.2 32% 435.3 19% 519.5 15% 598.3 (64.5) 40.4% -4.1% 42% 0.0 #DIV/0! 372.1 13% -20% (39.6) (56.2) (0.7) 15% 14% 25% 524.7 4%,-35-6%,-06: 27% 0% 12% (82.2) (0.8) -25% -38% 13% 13%, (61.3) (0.5) (0.8) Total Equity 420.3 587.7 664.8 44.9% 44.3% Total Liabilities & Equity -9 2.7. 100.0% 100.0% RATIO ANALYSIS Herman Miller RMA Industry Comparison 5/31/2014 5/30/2015 5/28/2016 6/3/2017 6/2/2018 ASSET MANAGEMENT Inventory Turnover 16.0 10.4 10.8 (COGS/Inventory) Total Asset Turnover 33.6 DSO (AR Period) (365/AR Turnover) Inventory Period (365/lnventory Turnover) Days in AP (AP Period) (365/[COGS/AP]) 32 35 45 23 51 59 37 73 34 30 39 38 31 23 34 39.3 Cash Cycle LEVERAGE TIE (EBIT / Interest) Debt / Equity (RMA DebtWorth Cash Coverage Ratio PROFITABILITY % Profit BT / Tot Assets Gross Profit PM (NI/Sales) RMA uses NBT DuPont Analysis: ROE- ROE (NI / Total Equity) ROA (NI / Total Assets) PM (NI / Sales) Total Asset Turnover Equity Multiplier (A/E) 13.7 12.6 12.2 17.2 16.4 4.38% 3355% -1.17% 12.17% 36.94% 45 % 15.92% 38.60% 6.04% 13.60% 37.93% 5.44% 11.36% 36.66% 538% 13.40% 28.30% 45% 20.69% 9.48% 5.44% 1.74 25.88% 10.35% 22.61% 8.17% 45 % 1.80 2.77 -5.94% -2.23% 25.48% 11 .07% 6.04% 1.83 2.30 18.87% 539% 2.18 1.90 2.66 2.30 2.50 Management's estimate of the Reevaluated every year and ad Herman Miller (000,000's are omitted all numbers are in millions) Proformas Inputs are highlighted FYE 6/2/2018 CS % of Sales Proforma 100% 2,381.2 -63%-(1,508.2) 873.0 (549.8) (78.8) Sales 2,381.2 Cost of Goods Sold(COGS) -(1,508.2) Gross Profit Operating Expense Research & Dev. &Non Rec Depreciation Expense (78.8) (66.9) -3% -3% Step 1: Input Parameter Estimates 66.9)Parameters & Ratios EBIT Less (Expenses) Income 177.5 Days Sales Outstanding Days in Inventory Days in Accounts Payable Interest (Expense) (19.0) Interest Income Other (Expenses) Income Net Other Expenses (Income) NIBT 3) 4) (0.3) (19.3) 158.2 0% Growth Rate on Sales Income taxes Equity Earning & Noncontrol Net Income Interest & Tax Rate Parameters Marketable Sec. Long Term Invest. 7.00% Dividends Retained Earnings Long Term Debt Tax Rate 6.90% 42.00% 128.7 94.8 Herman Miller Balance Sheet (000's) ASSETS Cash & Mkt Securties (plug) Accounts Receivable Inventory Prepaids Other Current Assets CS % of 6/2/2018 Tot Assets FYE 212.5 162.4 Proforma Step 2: Balance Sheet Check 15% 219.3 Make sure your proforma balance sheet is 162.4 balanced. Use the plugs to force A -LE. Use the following Balance Sheet Check Total Assets Total Liabilities & Equity -1445.6 Should be0: A- (L+E)(178.6) If not adjust plug until it is 1,267.0 Total Current Assets 645.4 44% Property, Plant, & Equip Notes Receivables Other Assets 432.9 331.4 198.6 Total Assets 100%, 26.0 LIABILITIES Notes Payable - Bank (Plug) Accounts Payable Accruals Current Maturities LTD Other Current Liabilities 242.4 242.4 413.8 Total Current Liabilities Other Liabilities Long Term Debt (LTD) 275.0 784.2 Total Liabilities Reedemable Noncontrolling Common Stock Additional Paid-In Cap & Othe Retained Earnings 784.2 55% 116.1 Total Liabilities & Equity 1,479.5 100% 1.446 Herman Miller MLHRI Common Size Analysis Proj General Guidelines: Each inivicdual shukthrdats from Esa the Ci You car discuss wour answurs with the rroun t tunirz in the assiun Hand in a printout of the ratio page (see tab below) and a printout of this instruction sheet with your completed answers. You are not required to type your answers but you may type and highlight yo A. Obtain the most recent annual financial report (10-K) for Miller Herman using KDG Uier Conpany Ticker enter MIHR for Herman Mille B. Use MLHR's 10-K annual report from Edgar.com to find Financial Information for Common Fill In your answers in the yellow Boxes below. The light red arrows indicate the answers you need to provid For drop-down boxes, choose thec appropriate ans Lacate the most recent 10-K report and click the Internstive Dntn link an the web page then click Finan .Click on the Incoe Statement tab below and fill in the information fiom Consolidated Statements of to fill in tbe hiohliohted arca of the sorcadshect. Note use the reevious vcar's information Noticc thec footnote on the bottom of the Income Stateneut reardin Deorciati 2. Click on the Balance Shect tab below and fill in the information from Consolidated Balancc Sheet alance Sheet tab bome Stateneyear's C. Answer the followine auestions recardine Herman Miller. 1. DuPont Analvsis is a great place to start the analysis, bocause it shows how three major areas interact to deten PM TAT EM (lint: Click the Ratios tab below to fill in the appropriate ratios to compare MLIIR to MLHR Indust 25.9% 4.50% 2.30 250 18.87% 5.38% 1.61 2.18 2. What component(s) dae) improving MLI IR's ROE relative to thus industry avera Equity mutiplier sset efficiency and equitv mul Profit mard Based this DuPont analysis which of the following areas are strngths for MLHR? (could be this DuPornt analysis which f the following aruas are weaknesses for MLIIR? (could be Based S. Iow long is the operating cycle fr MLIIR for the most recent year ending financial informatiun? ( 6. low long is the cashcycle fr MLIIR for th ms recernt year ending firnarcia information? Se R 7. Is the length of the peraling yka strerngth or weakness for MIHR cornpared to th Operating Cycle Cash Cycle in Days in Days- 31.4 l'he length f Ml.HR's mperating cycle is a strenrth compared to the industry aven. 8. If MLHR'scash ele increases sismificantly it would 9. 1.ook at the trends ver theast 5 Years for the following rato categories. Identify whether the MLHRs cash cvcle would increase siani if decreased the amount of credit it a. Liquidi b. Inventry Turnver e. Total AssetT d. Days Sales Outstandi e. Asset Manapement deteriorat deterioratin, or rneither. For ratius that fAuctuate over tim cumipare 5 years a with the est deteriorat neither improving improving umovr e.roitabilite 10wiat account causes the current ratio to be smaller than the industry, and dic quick ratio to be simila Inventov causes the current ratio to be and the auick ratio to be similar to the i The amount of time it takes Herman Mill its' suppliers does not seem to be a pro maller th 11. Docs the amount of time it takes Herman Millcr to pay it's supplicrs appcar to Hint: copare their ratios to the industry) 12. When comparing the assets on the balance sheet to industry avcrages, what accoumt sbould the anal- The analyst questin the accounts reci What was MLTIR's Net Working Capital for the last two years ( Most Current Year Previous Year 109 1 14. Iow big a factor would vou say market cxiditions nlaved othenefoa ance of MLIIR over the 15. Suppose MLIIR doubled the amount of time to pay trade creditors. Use the proforma sheet to indicate the impact on theiL Cash& Marketable Securitie b Notes Payable Bank tatements. Start with the iderntical parameters indicated on Ratio page foe previous year for Inv, AR, and AP and then doub What is he new lus figure to make he belanco sheet balance? Slate answur umulting the last 000.000s cursslat with (Note one vluc is alwavs zcro for cells D28 and D41 on the Troforna Soreadsh Cash & Marketable Securitie b. Notes Payable Bank 16. Suppose MLIR Days Payable is at the same level as tke prior year. Use the proforma sheet to indicate the impact on the fin staternents assuning Days Sales Outstanding and Days in Inventory both double, causing the operating cyele What are the new nlur fiure to rnake the balance sheet balance? State answer onittin the last 000.000's coisistent with rof e one nlu is alwavs zuro for cells D28 and D41 on the Proformna 17. Using the same parameters as in question 16, what is the proforma Net Income (Loss) Proforma Net Income 18. Suppose all paraneter estirnates are based on last years results, except Sales is expected to grow at & Marketable Securities What would be the impact on Net Incone and the Plugs? Note onit 000,000's and one of the plug Notes Payable Bank 19. Assurrimg MI IR is uxpecting a 25% increase m Sales and they have the p ant capacity, what should hey do nuan opm on


 I posted all the information you need. The last few questions I'm very confused on, please help!


