Answered step by step
Verified Expert Solution
Question
1 Approved Answer
I posted these questions on Chegg yesterday and never got help. Please answer these five questions. Please take your time so I can get the


I posted these questions on Chegg yesterday and never got help. Please answer these five questions. Please take your time so I can get the right answers and explanations for these questions.
Please answer these five questions correctly based on the income statements for Fedex and Ups on the last two pages
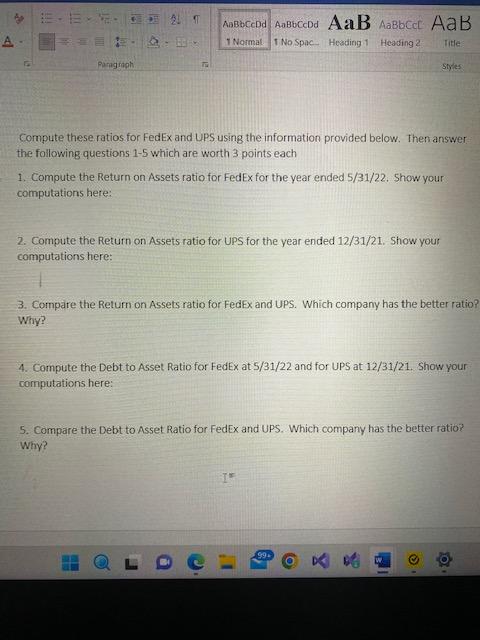
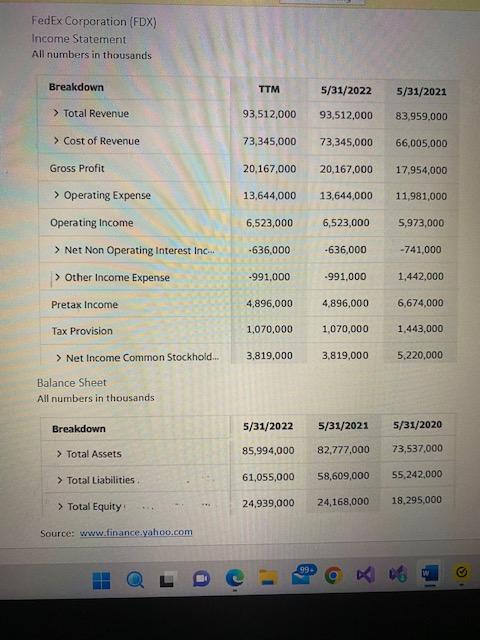
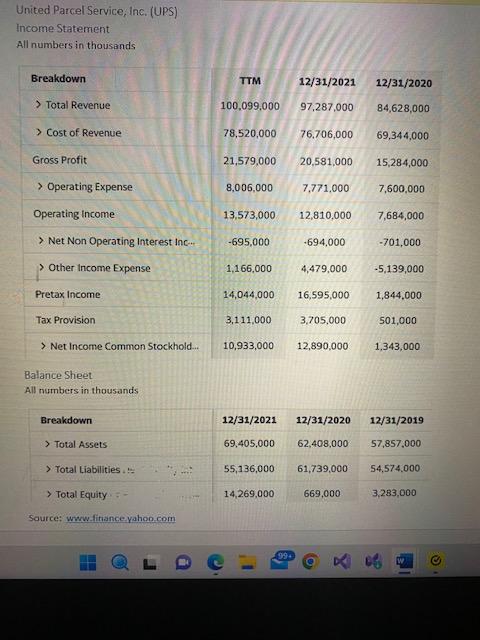
Compute these ratios for FedEx and UPS using the information provided below. Then answer the following questions 1-5 which are worth 3 points each 1. Compute the Return on Assets ratio for FedEx for the year ended 5/31/22. Show your computations here: 2. Compute the Return on Assets ratio for UPS for the year ended 12/31/21. Show your computations here: 3. Compare the Return on Assets ratio for FedEx and UPS. Which company has the better ratio? Why? 4. Compute the Debt to Asset Ratio for FedEx at 5/31/22 and for UPS at 12/31/21. Show your computations here: 5. Compare the Debt to Asset Ratio for FedEx and UPS. Which company has the better ratio? Why? FedEx Corporation (FDX) Income Statement All numbers in thousands United Parcel Service, Inc. (UPS) Income Statement All numbers in thousands \begin{tabular}{|l|ccc|} \hline Breakdown & TTM & 12/31/2021 & 12/31/2020 \\ \hline Potal Revenue & 100,099,000 & 97,287,000 & 84,628,000 \\ \hline> Cost of Revenue & 78,520,000 & 76,706,000 & 69,344,000 \\ \hline Gross Profit & 21,579,000 & 20,581,000 & 15,284,000 \\ \hline> Operating Expense & 8,006,000 & 7,771,000 & 7,600,000 \\ \hline Operating Income & 13,573,000 & 12,810,000 & 7,684,000 \\ \hline> Net Non Operating Interest Inc.-. & 695,000 & 694,000 & 701,000 \\ \hline> Other income Expense & 1,166,000 & 4,479,000 & 5,139,000 \\ \hline Pretax Income & 14,044,000 & 16,595,000 & 1,844,000 \\ \hline Tax Provision & 3,111,000 & 3,705,000 & 501,000 \\ \hline > Net Income Common Stockhold.. & 10,933,000 & 12,890,000 & 1,343,000 \\ \hline \end{tabular} Balance Sheet All numbers in thousands \begin{tabular}{|l|ccc} \hline Breakdown & 12/31/2021 & 12/31/2020 & 12/31/2019 \\ \hline > Total Assets & 69,405,000 & 62,408,000 & 57,857,000 \\ > Total Liabilities : = & 55,136,000 & 61,739,000 & 54,574,000 \\ > Total Equity = & 14,269,000 & 669,000 & 3,283,000 \end{tabular} Source: wrw-fitance yahoo. com Compute these ratios for FedEx and UPS using the information provided below. Then answer the following questions 1-5 which are worth 3 points each 1. Compute the Return on Assets ratio for FedEx for the year ended 5/31/22. Show your computations here: 2. Compute the Return on Assets ratio for UPS for the year ended 12/31/21. Show your computations here: 3. Compare the Return on Assets ratio for FedEx and UPS. Which company has the better ratio? Why? 4. Compute the Debt to Asset Ratio for FedEx at 5/31/22 and for UPS at 12/31/21. Show your computations here: 5. Compare the Debt to Asset Ratio for FedEx and UPS. Which company has the better ratio? Why? FedEx Corporation (FDX) Income Statement All numbers in thousands United Parcel Service, Inc. (UPS) Income Statement All numbers in thousands \begin{tabular}{|l|ccc|} \hline Breakdown & TTM & 12/31/2021 & 12/31/2020 \\ \hline Potal Revenue & 100,099,000 & 97,287,000 & 84,628,000 \\ \hline> Cost of Revenue & 78,520,000 & 76,706,000 & 69,344,000 \\ \hline Gross Profit & 21,579,000 & 20,581,000 & 15,284,000 \\ \hline> Operating Expense & 8,006,000 & 7,771,000 & 7,600,000 \\ \hline Operating Income & 13,573,000 & 12,810,000 & 7,684,000 \\ \hline> Net Non Operating Interest Inc.-. & 695,000 & 694,000 & 701,000 \\ \hline> Other income Expense & 1,166,000 & 4,479,000 & 5,139,000 \\ \hline Pretax Income & 14,044,000 & 16,595,000 & 1,844,000 \\ \hline Tax Provision & 3,111,000 & 3,705,000 & 501,000 \\ \hline > Net Income Common Stockhold.. & 10,933,000 & 12,890,000 & 1,343,000 \\ \hline \end{tabular} Balance Sheet All numbers in thousands \begin{tabular}{|l|ccc} \hline Breakdown & 12/31/2021 & 12/31/2020 & 12/31/2019 \\ \hline > Total Assets & 69,405,000 & 62,408,000 & 57,857,000 \\ > Total Liabilities : = & 55,136,000 & 61,739,000 & 54,574,000 \\ > Total Equity = & 14,269,000 & 669,000 & 3,283,000 \end{tabular} Source: wrw-fitance yahoo. com
Step by Step Solution
There are 3 Steps involved in it
Step: 1

Get Instant Access to Expert-Tailored Solutions
See step-by-step solutions with expert insights and AI powered tools for academic success
Step: 2

Step: 3

Ace Your Homework with AI
Get the answers you need in no time with our AI-driven, step-by-step assistance
Get Started


