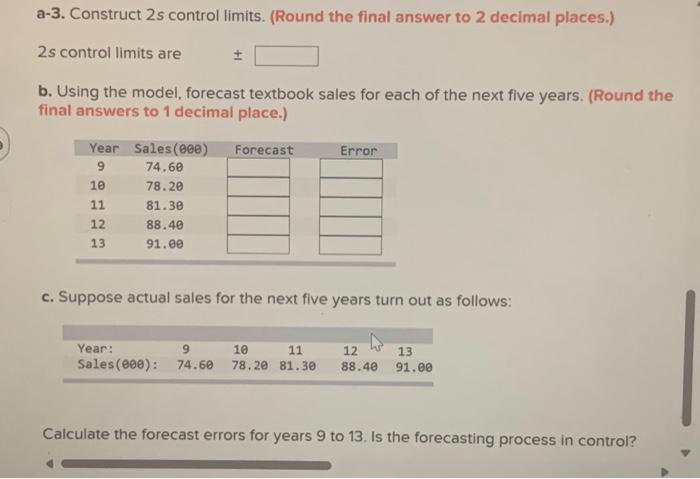
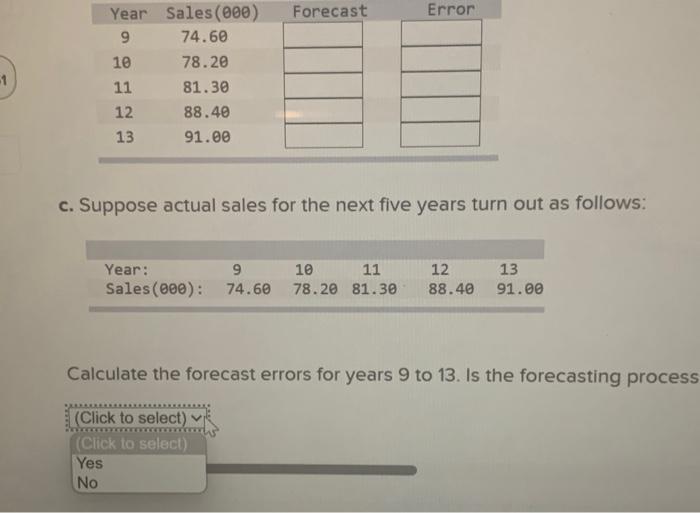
i provided every blank space and its option pls fill all data , ( round the final answers to 1 decimal place )
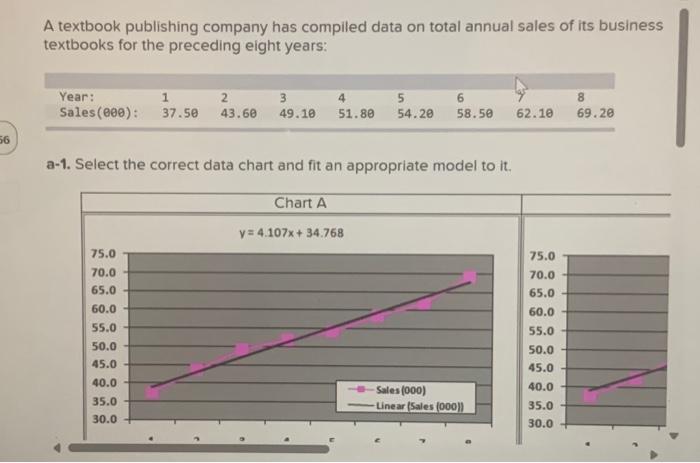
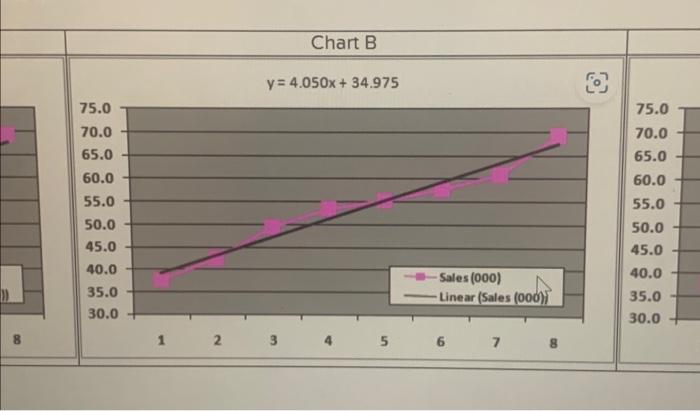
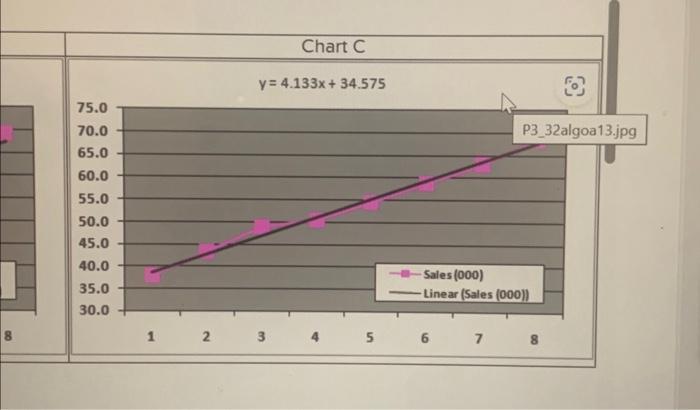
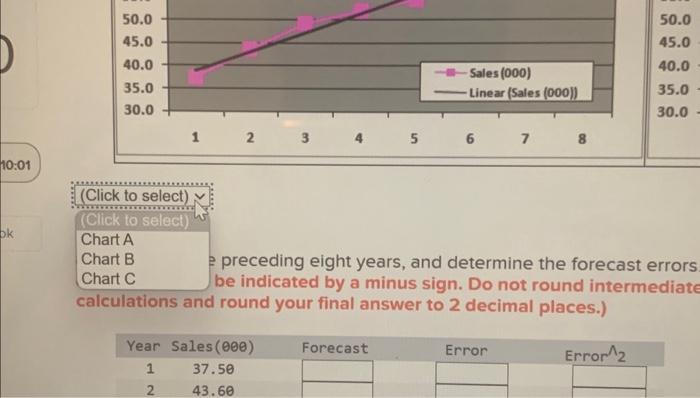
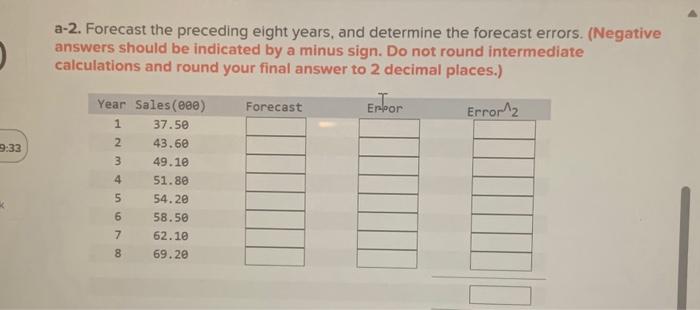
b. Using the model, forecast textbook sales for each of the next five years. (Round the final answers to 1 decimal place.) c. Suppose actual sales for the next five years turn out as follows: Calculate the forecast errors for years 9 to 13 . Is the forecasting process in control? A textbook publishing company has compiled data on total annual sales of its business textbooks for the preceding eight years: a-1. Select the correct data chart and fit an appropriate model to it. Suppose actual sales for the next five years turn out as follows: Calculate the forecast errors for years 9 to 13 . Is the forecasting proces: preceding eight years, and determine the forecast errors be indicated by a minus sign. Do not round intermediate calculations and round your final answer to 2 decimal places.) \begin{tabular}{|cc|c|c|} \hline Year Sales () & \multicolumn{2}{c|}{ Forecast } & \multicolumn{2}{c|}{ Error Error 2} \\ \hline 1 & 37.50 & & \\ \hline 2 & 43.60 & & \\ \hline \end{tabular} a-2. Forecast the preceding eight years, and determine the forecast errors. (Negative answers should be indicated by a minus sign. Do not round intermediate calculations and round your final answer to 2 decimal places.) b. Using the model, forecast textbook sales for each of the next five years. (Round the final answers to 1 decimal place.) c. Suppose actual sales for the next five years turn out as follows: Calculate the forecast errors for years 9 to 13 . Is the forecasting process in control? A textbook publishing company has compiled data on total annual sales of its business textbooks for the preceding eight years: a-1. Select the correct data chart and fit an appropriate model to it. Suppose actual sales for the next five years turn out as follows: Calculate the forecast errors for years 9 to 13 . Is the forecasting proces: preceding eight years, and determine the forecast errors be indicated by a minus sign. Do not round intermediate calculations and round your final answer to 2 decimal places.) \begin{tabular}{|cc|c|c|} \hline Year Sales () & \multicolumn{2}{c|}{ Forecast } & \multicolumn{2}{c|}{ Error Error 2} \\ \hline 1 & 37.50 & & \\ \hline 2 & 43.60 & & \\ \hline \end{tabular} a-2. Forecast the preceding eight years, and determine the forecast errors. (Negative answers should be indicated by a minus sign. Do not round intermediate calculations and round your final answer to 2 decimal places.)


