

Answered step by step
Verified Expert Solution
Question
1 Approved Answer
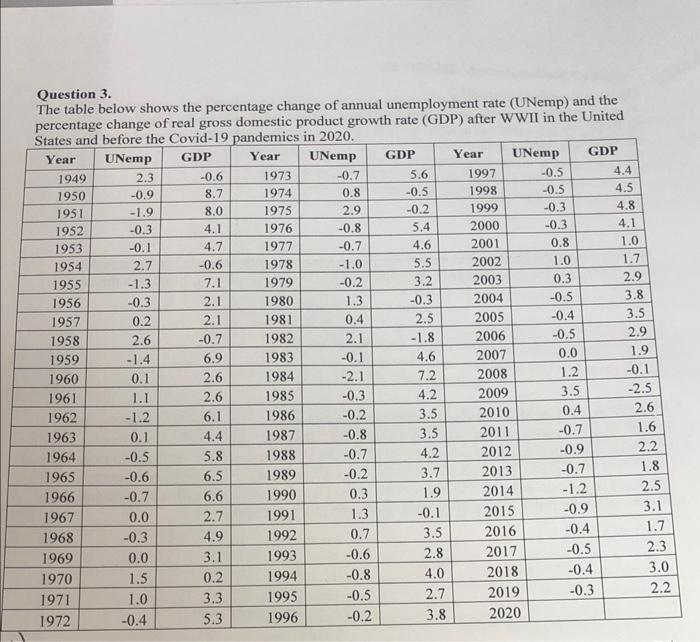
i send the whole question but cant fogure out. Question 3. The table below shows the percentage change of annual unemployment rate (UNemp) and the
i send the whole question but cant fogure out. 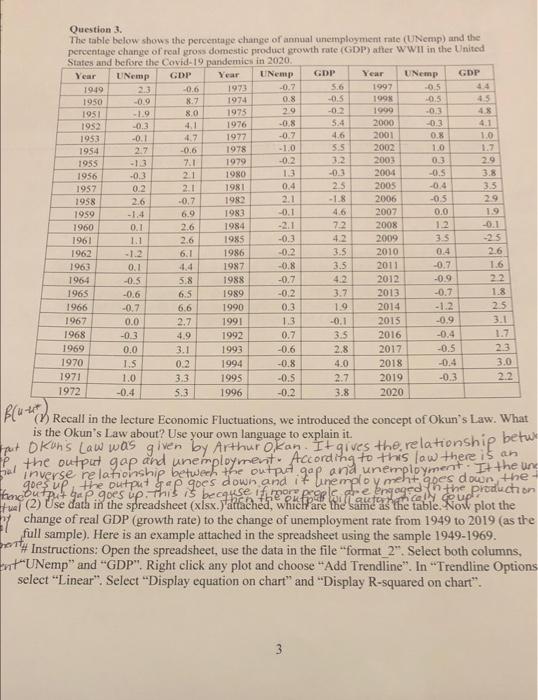
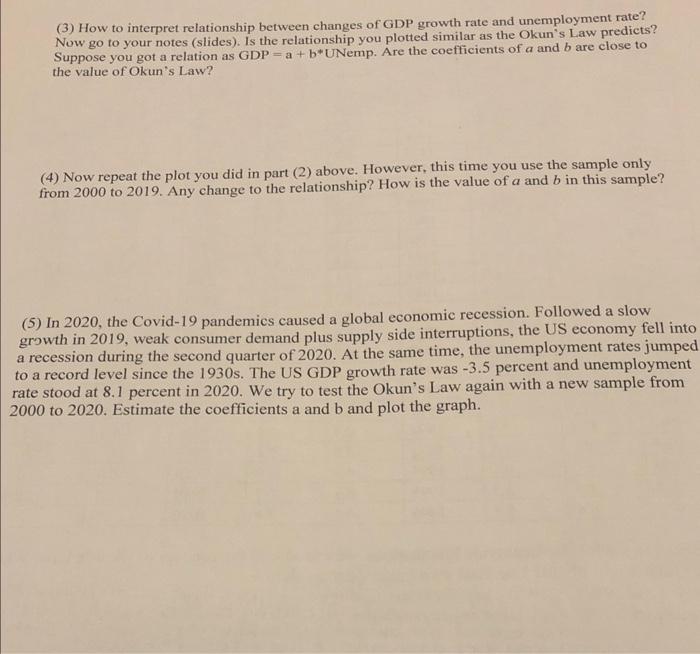
Question 3. The table below shows the percentage change of annual unemployment rate (UNemp) and the United (4) Now repeat the plot you did in part (2) above. However, this time you use the sample only from 2000 to 2019 . Any change to the relationship? How is the value of a and b in this sample? Question 3. The table below shows the percentage change of annual unemployment nate (UNemp) and the percentage change of real gross domestic product growth rate (GDF) atter WWII in the United (u th () Recall in the lecture Economic Fluctuations, we introduced the concept of Okun's Law. What is the Okun's Law about? Use your own language to explain it. fut OKuhs Law was given by Arthur O,kan. It gives the, relationship betwi p the output gap and unemployment. According to this law there is an inverse relationship betwerh the output gap and unemployment. It the un change of real GDP (growth rate) to the change of unemployment rate from 1949 to 2019 (as the full sample). Here is an example attached in the spreadsheet using the sample 1949-1969. At Instructions: Open the spreadsheet, use the data in the file "format_ 2 ". Select both columns, ent "UNemp" and "GDP". Right click any plot and choose "Add Trendline". In "Trendline Options select "Linear". Select "Display equation on chart" and "Display R-squared on chart". (3) How to interpret relationship between changes of GDP growth rate and unemployment rate? Now go to your notes (slides). Is the relationship you plotted similar as the Okun's Law predicts? Suppose you got a relation as GDP =a+b UNemp. Are the coefficients of a and b are close to the value of Okun's Law? (4) Now repeat the plot you did in part (2) above. However, this time you use the sample only from 2000 to 2019. Any change to the relationship? How is the value of a and b in this sample? (5) In 2020, the Covid-19 pandemics caused a global economic recession. Followed a slow growth in 2019, weak consumer demand plus supply side interruptions, the US economy fell into a recession during the second quarter of 2020 . At the same time, the unemployment rates jumped to a record level since the 1930s. The US GDP growth rate was -3.5 percent and unemployment rate stood at 8.1 percent in 2020 . We try to test the Okun's Law again with a new sample from 2000 to 2020 . Estimate the coefficients a and b and plot the graph. Question 3. The table below shows the percentage change of annual unemployment rate (UNemp) and the United (4) Now repeat the plot you did in part (2) above. However, this time you use the sample only from 2000 to 2019 . Any change to the relationship? How is the value of a and b in this sample? Question 3. The table below shows the percentage change of annual unemployment nate (UNemp) and the percentage change of real gross domestic product growth rate (GDF) atter WWII in the United (u th () Recall in the lecture Economic Fluctuations, we introduced the concept of Okun's Law. What is the Okun's Law about? Use your own language to explain it. fut OKuhs Law was given by Arthur O,kan. It gives the, relationship betwi p the output gap and unemployment. According to this law there is an inverse relationship betwerh the output gap and unemployment. It the un change of real GDP (growth rate) to the change of unemployment rate from 1949 to 2019 (as the full sample). Here is an example attached in the spreadsheet using the sample 1949-1969. At Instructions: Open the spreadsheet, use the data in the file "format_ 2 ". Select both columns, ent "UNemp" and "GDP". Right click any plot and choose "Add Trendline". In "Trendline Options select "Linear". Select "Display equation on chart" and "Display R-squared on chart". (3) How to interpret relationship between changes of GDP growth rate and unemployment rate? Now go to your notes (slides). Is the relationship you plotted similar as the Okun's Law predicts? Suppose you got a relation as GDP =a+b UNemp. Are the coefficients of a and b are close to the value of Okun's Law? (4) Now repeat the plot you did in part (2) above. However, this time you use the sample only from 2000 to 2019. Any change to the relationship? How is the value of a and b in this sample? (5) In 2020, the Covid-19 pandemics caused a global economic recession. Followed a slow growth in 2019, weak consumer demand plus supply side interruptions, the US economy fell into a recession during the second quarter of 2020 . At the same time, the unemployment rates jumped to a record level since the 1930s. The US GDP growth rate was -3.5 percent and unemployment rate stood at 8.1 percent in 2020 . We try to test the Okun's Law again with a new sample from 2000 to 2020 . Estimate the coefficients a and b and plot the graph Step by Step Solution
There are 3 Steps involved in it
Step: 1

Get Instant Access to Expert-Tailored Solutions
See step-by-step solutions with expert insights and AI powered tools for academic success
Step: 2

Step: 3
Ace Your Homework with AI
Get the answers you need in no time with our AI-driven, step-by-step assistance
Get Started
Balancing Acts Unleashing The Power Of Creativity In Your Life And Work
Authors: Daniel Lamarre
1st Edition
1400223024, 978-1400223022