I want it solve with explanation.


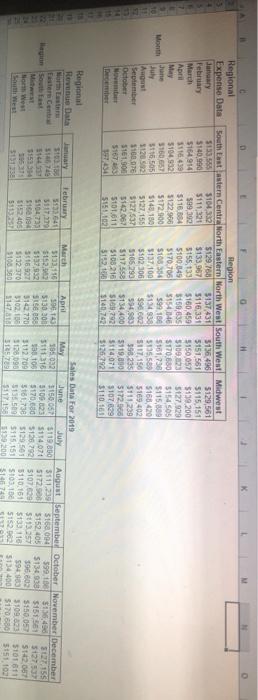
Regional Expense Data January February March April May Month June July Agnt September (october Region South East astern Centre North Eastern North West South West Midwest 5133.559 3104330 $129,788 5137 431 5136 496 5129,561 $140.990 5111,320 $133,957 5116,331 5151.561 5115,151 5164914 599 300 5155133 $150,450 5150,057 $199.200 1118439 $116.654 5100 145 5150635 $109.223 5127.929 5104 932 $122.966 $170.700 $1541 $170.680 5154505 5160657 5172.900 $108354 599 100 5161730 $115,689 5116,505 5143 180 5137100 $134930 $135.589 5168, 420 1120532 5127,155 $502306 S96.602 11000T 5117. 150 5169.402 $127.537 5106290 594989 398.235 5161.900 5111239 5142.067 5117558 5134400 5172.000 51674 5119.000 5101.611 5103 210 109.792 5114071 5155102 $107629 3120 3140742 $125292 $110161 Regional Revenue Data 3131 Fastern Cente 3533761 5111,179 5104733 516 5152400 March 3133110 $152. 5137932 5:16.997 51322370 11000 April 1961 5130 300 StS 58 5143.770 Mit Sales Data For 2013 May June July August September October November December 196032 3150057 $119 300 5160 04 $99. $1.450 127.15$ 5111316 3109023 5114.070 5172.00 5152405 5134938 5151561 512753 53000 5170.680 5120792 510729 57130257 196.80 5150 057 5142.00 5112709 5161.730 5129.500 5110.16 $133.110 59483 3109 5101 811 5136090 513550 511551 S1031 5152. 5117 5170680515110 5134400 510200 $14074 STO 3150 1052 31128 Profitability (Revenue-Expense) Analysis December Eastern Central The only cells you are allowed to change are the yellow and blue cols Select sheet tab Profitability Analysis This sheet contains monthly revenue and expense data for 2019 for the six sales regions in a company. Develop a query that will allow you to observe the profitability of a particular region in a particular month in cell G32 (the yellow cell) by selecting the region name in cell F32 and the month in cell G31. Use the MATCH and OFFSET commands to create a single formula in cell G32 that computes the profitability (Revenue minus Expense) of the region and month specified in cells F32 and G31 respectively. Use Data Validation to provide a drop-down list of permissible entries for the cells F32 and G31. Regional Expense Data January February March April May Month June July Agnt September (october Region South East astern Centre North Eastern North West South West Midwest 5133.559 3104330 $129,788 5137 431 5136 496 5129,561 $140.990 5111,320 $133,957 5116,331 5151.561 5115,151 5164914 599 300 5155133 $150,450 5150,057 $199.200 1118439 $116.654 5100 145 5150635 $109.223 5127.929 5104 932 $122.966 $170.700 $1541 $170.680 5154505 5160657 5172.900 $108354 599 100 5161730 $115,689 5116,505 5143 180 5137100 $134930 $135.589 5168, 420 1120532 5127,155 $502306 S96.602 11000T 5117. 150 5169.402 $127.537 5106290 594989 398.235 5161.900 5111239 5142.067 5117558 5134400 5172.000 51674 5119.000 5101.611 5103 210 109.792 5114071 5155102 $107629 3120 3140742 $125292 $110161 Regional Revenue Data 3131 Fastern Cente 3533761 5111,179 5104733 516 5152400 March 3133110 $152. 5137932 5:16.997 51322370 11000 April 1961 5130 300 StS 58 5143.770 Mit Sales Data For 2013 May June July August September October November December 196032 3150057 $119 300 5160 04 $99. $1.450 127.15$ 5111316 3109023 5114.070 5172.00 5152405 5134938 5151561 512753 53000 5170.680 5120792 510729 57130257 196.80 5150 057 5142.00 5112709 5161.730 5129.500 5110.16 $133.110 59483 3109 5101 811 5136090 513550 511551 S1031 5152. 5117 5170680515110 5134400 510200 $14074 STO 3150 1052 31128 Profitability (Revenue-Expense) Analysis December Eastern Central The only cells you are allowed to change are the yellow and blue cols Select sheet tab Profitability Analysis This sheet contains monthly revenue and expense data for 2019 for the six sales regions in a company. Develop a query that will allow you to observe the profitability of a particular region in a particular month in cell G32 (the yellow cell) by selecting the region name in cell F32 and the month in cell G31. Use the MATCH and OFFSET commands to create a single formula in cell G32 that computes the profitability (Revenue minus Expense) of the region and month specified in cells F32 and G31 respectively. Use Data Validation to provide a drop-down list of permissible entries for the cells F32 and G31


