

Answered step by step
Verified Expert Solution
Question
1 Approved Answer
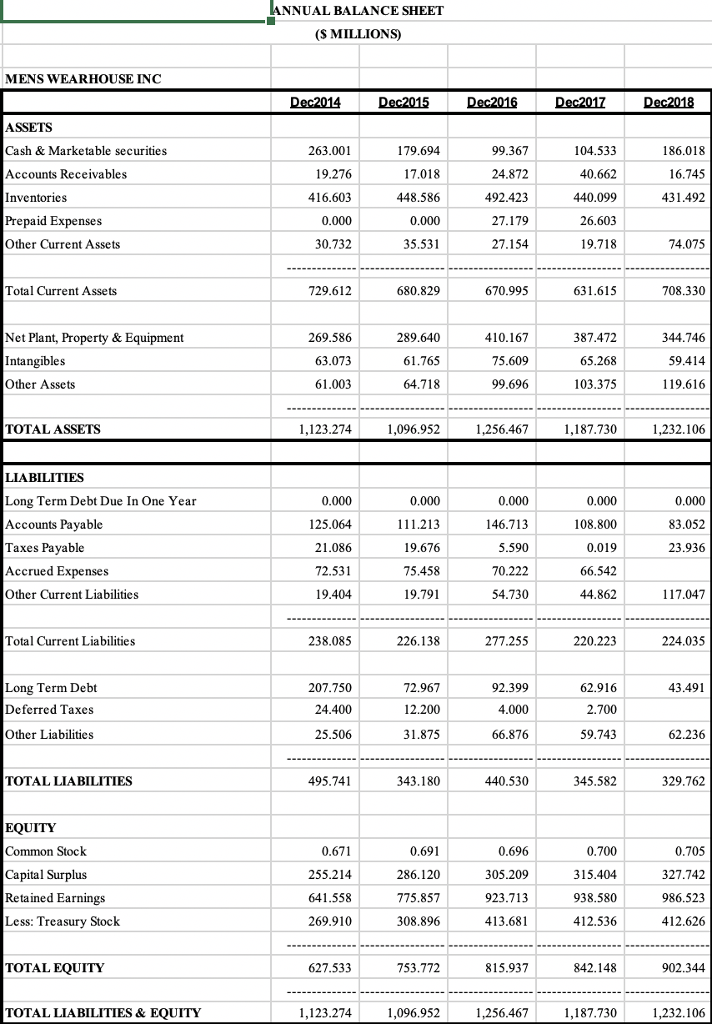
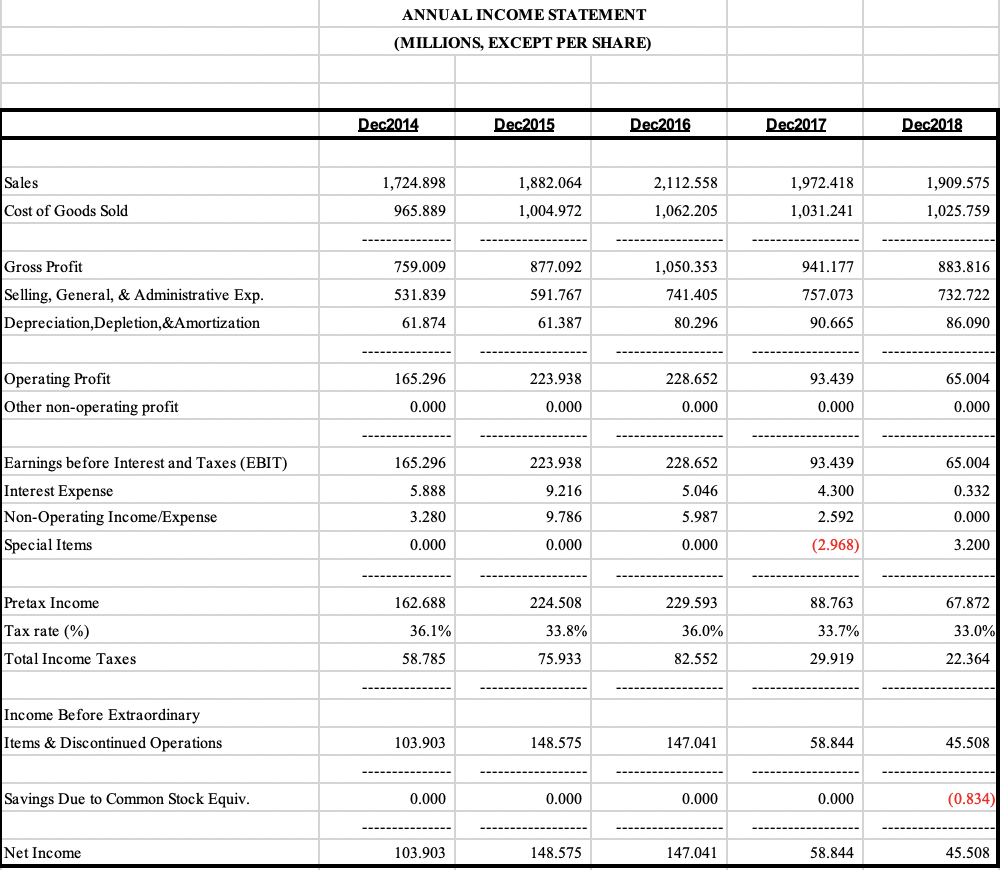
I want to know the four parts. Dec2014 Dec2015 Dec2016 Dec2017 Dec2018 Industry average 2018 Asset efficiency ratios Inventory turnover (times) 4.1 Inventory days (days)
I want to know the four parts.
| Dec2014 | Dec2015 | Dec2016 | Dec2017 | Dec2018 | Industry average 2018 | |
| Asset efficiency ratios | ||||||
| Inventory turnover (times) | 4.1 | |||||
| Inventory days (days) | 89.0 | |||||
| Acct. receivable days (days) | 3.2 | |||||
| Acct. payable days (days) | 24.9 |
Step by Step Solution
There are 3 Steps involved in it
Step: 1

Get Instant Access to Expert-Tailored Solutions
See step-by-step solutions with expert insights and AI powered tools for academic success
Step: 2

Step: 3
Ace Your Homework with AI
Get the answers you need in no time with our AI-driven, step-by-step assistance
Get Started
Day Trading Strategies And Risk Management
Authors: Richard N. Williams
1st Edition
979-8863610528