

Answered step by step
Verified Expert Solution
Question
1 Approved Answer
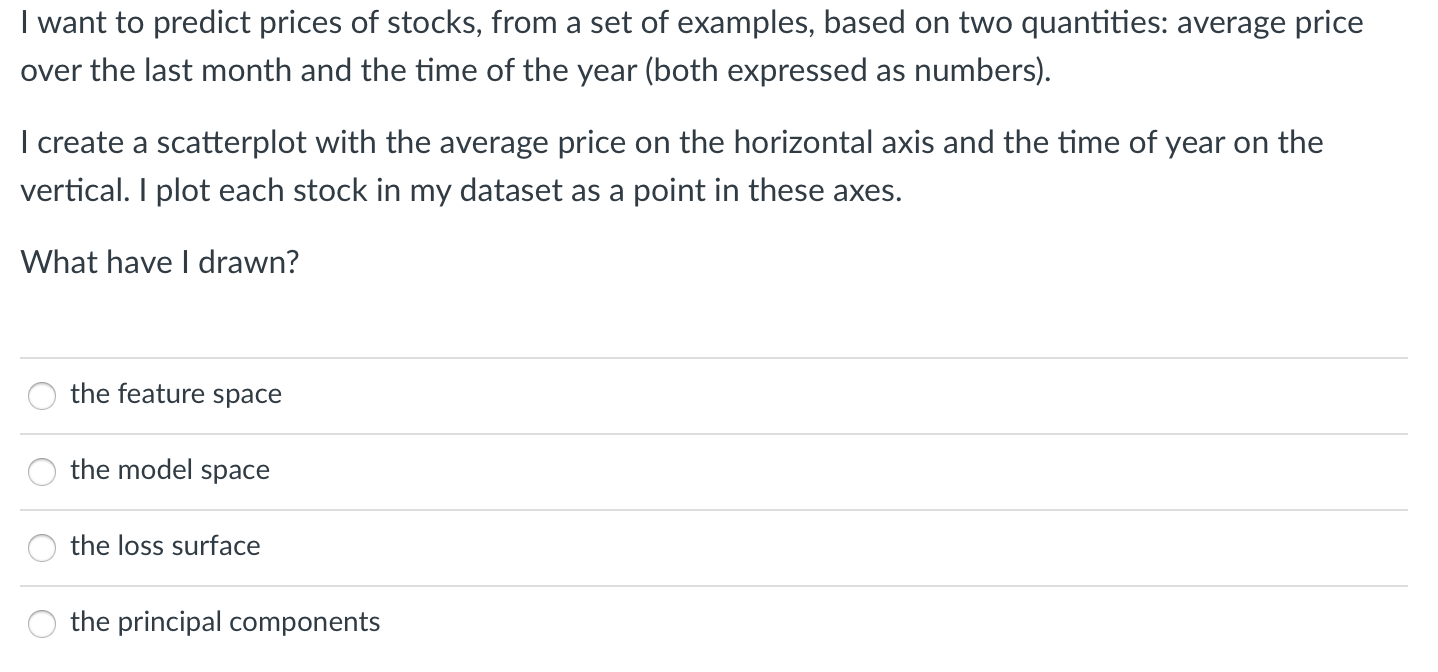
I want to predict prices of stocks, from a set of examples, based on two quantities: average price over the last month and the time
Step by Step Solution
There are 3 Steps involved in it
Step: 1

Get Instant Access to Expert-Tailored Solutions
See step-by-step solutions with expert insights and AI powered tools for academic success
Step: 2

Step: 3
Ace Your Homework with AI
Get the answers you need in no time with our AI-driven, step-by-step assistance
Get Started
The Routledge Companion To Accounting Education
Authors: Richard M.S. Wilson
1st Edition
0415697336, 9780415697330