Answered step by step
Verified Expert Solution
Question
1 Approved Answer
I want to verify these answers 1 Dave is analysing a work process and realizes that there are around 68,000 defects per million opportunities. What
I want to verify these answers
1
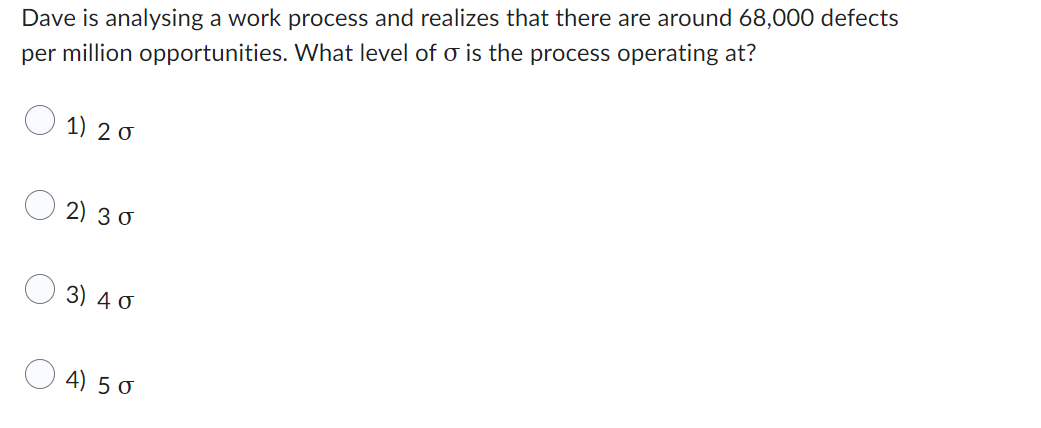
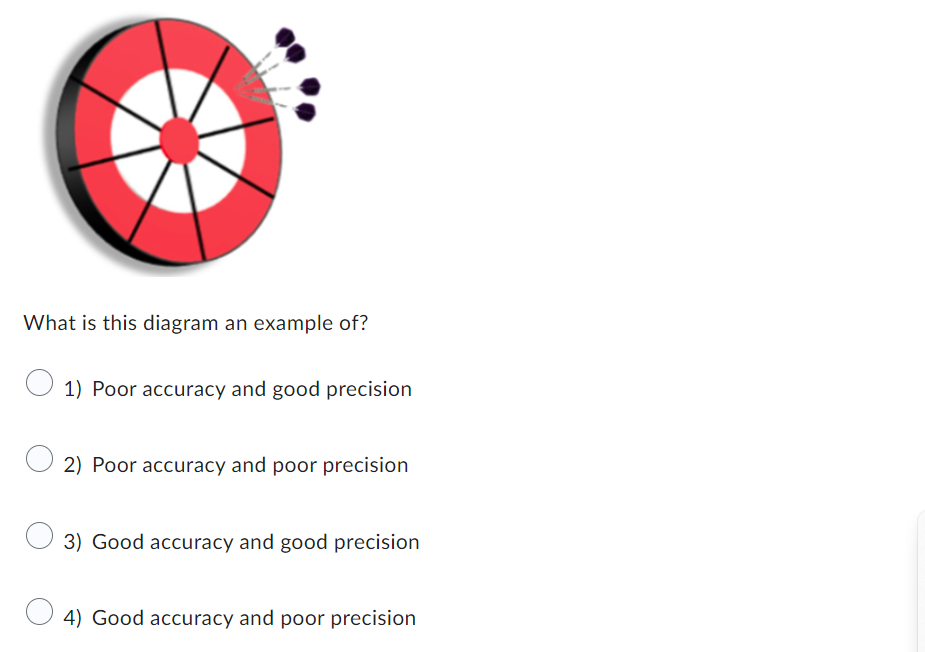
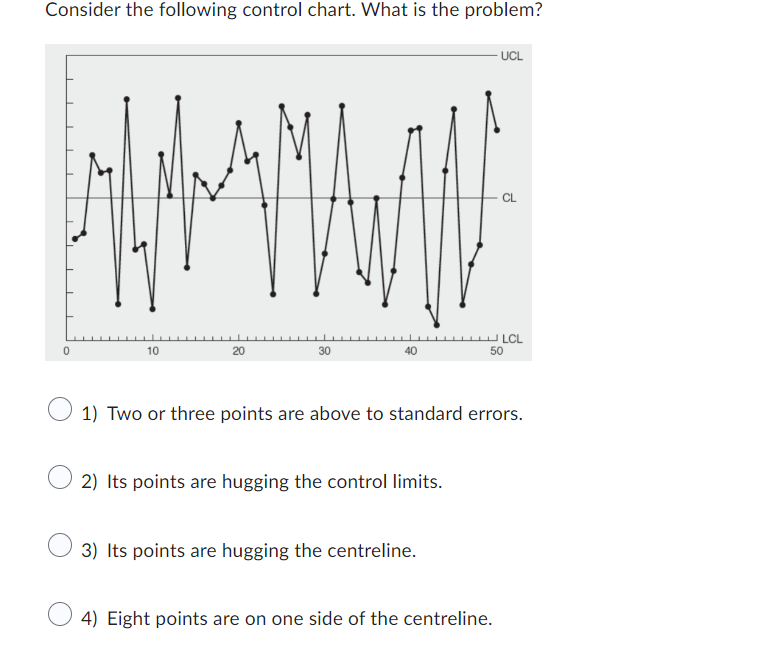
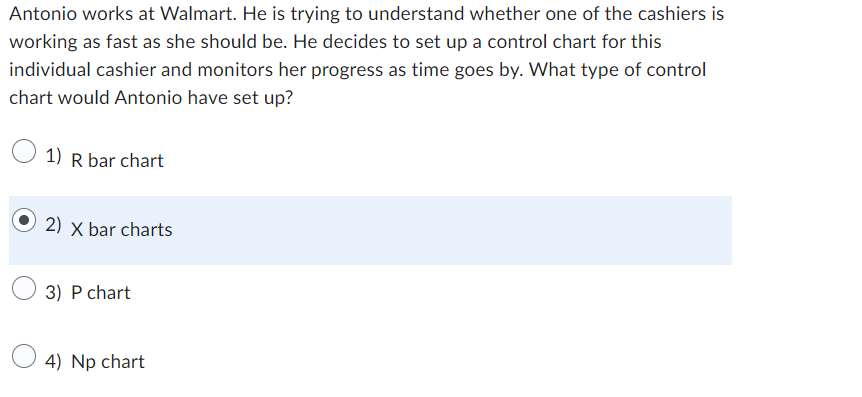
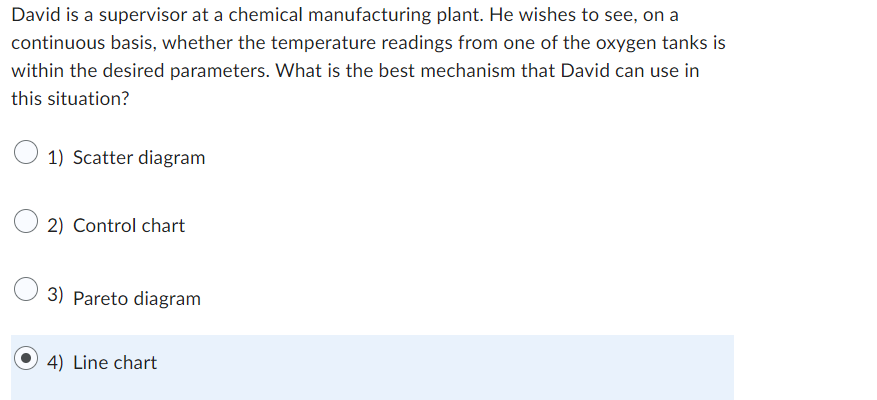
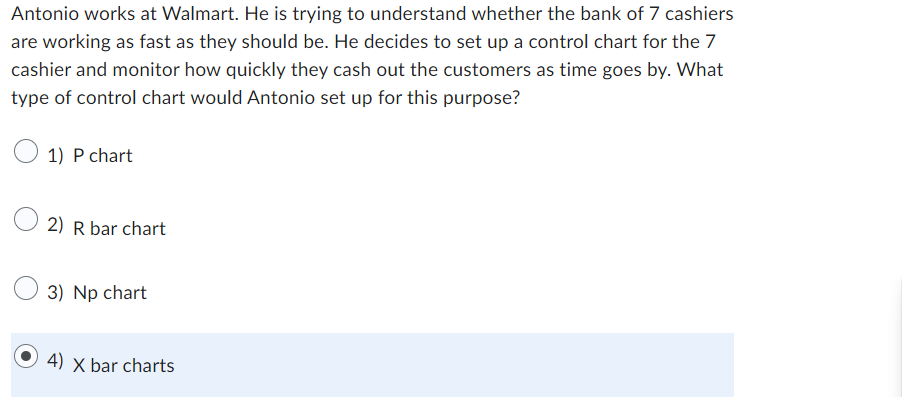
Dave is analysing a work process and realizes that there are around 68,000 defects per million opportunities. What level of o is the process operating at? ( 1) 20 ( 2) 30 ( 3) 40 ( 4) 5 0What is this diagram an example of? /H\\ E \\H/ J 1) Poor accuracy and good precision /H\\ E \\H/ J 2) Poor accuracy and poor precision I \\ i \\J 3) Good accuracy and good precision Consider the following control chart. What is the problem? .IIIAIII II Will; '\\\\I 1} Two or three points are above to standard errors. LHSL kN' 2} Its points are hugging the control limits kg \\' 3} Its points are hugging the centreline. x. k.) 4} Eight points are on one side of the centreline. Antonio works at Walmart. He is trying to understand whether one of the cashiers is working as fast as she should be. He decides to set up a control chart for this individual cashier and monitors her progress as time goes by. What type of control chart would Antonio have set up? l/\\l \\J 1} R bar chart (in \\J 2} X bar charts /'_'\\ '\\_/' 3} Pchart /'_'\\ k-) 4} No chart David is a supervisor at a chemical manufacturing plant. He wishes to see, on a continuous basis, whether the temperature readings from one of the oxvgen tanks is within the desired parameters. What is the best mechanism that David can use in this situation? /_\\ _ '\\_/' 1} Scatter diagram /_\\ '\\_/' 2} Control chart l/\\l \"w\" 33' Pareto diagram /_\\ K!) 4} Line chart Antonio works at Walmart. He is trying to understand whether the bank of 7 cashiers are working as fast as they should be. He decides to set up a control chart for the 7' cashier and monitor how quickly they cash out the customers as time goes by. What type of control chart would Antonio set up for this purpose? /_\\ '\\_/' 1} Pchart l/\\l \\J 2} R bar chart /_\\ '\\_/' 3} Np chart ./_\\ I I \\9/ 4} X bar chartsStep by Step Solution
There are 3 Steps involved in it
Step: 1
Get Instant Access to Expert-Tailored Solutions
See step-by-step solutions with expert insights and AI powered tools for academic success
Step: 2
Step: 3
Ace Your Homework with AI
Get the answers you need in no time with our AI-driven, step-by-step assistance
Get Started