Answered step by step
Verified Expert Solution
Question
1 Approved Answer
I would like some modifications to this code with explanation. ( I use Logistic regression, and Dataset: Female Diabetes ) . - The accuracy for
I would like some modifications to this code with explanation.
I use Logistic regression, and Dataset: Female Diabetes
The accuracy for training the model on all features is approximately: I tried to improve the models performance by deleting outliers or feature selection, and the accuracy was either lower or was the same as the previous accuracy. I do not know if I was determining the most influential features correctly or incorrectly.
I want to improve the model in any way, with a diagram that shows...and an explanation of the steps in detail
Also, one of the things required in this lab is to provide interesting information that I found while performing the lab. What can I provide?
Please be creative and show me your best. This is also one of the things required in the laptop. How can I achieve it in this model?
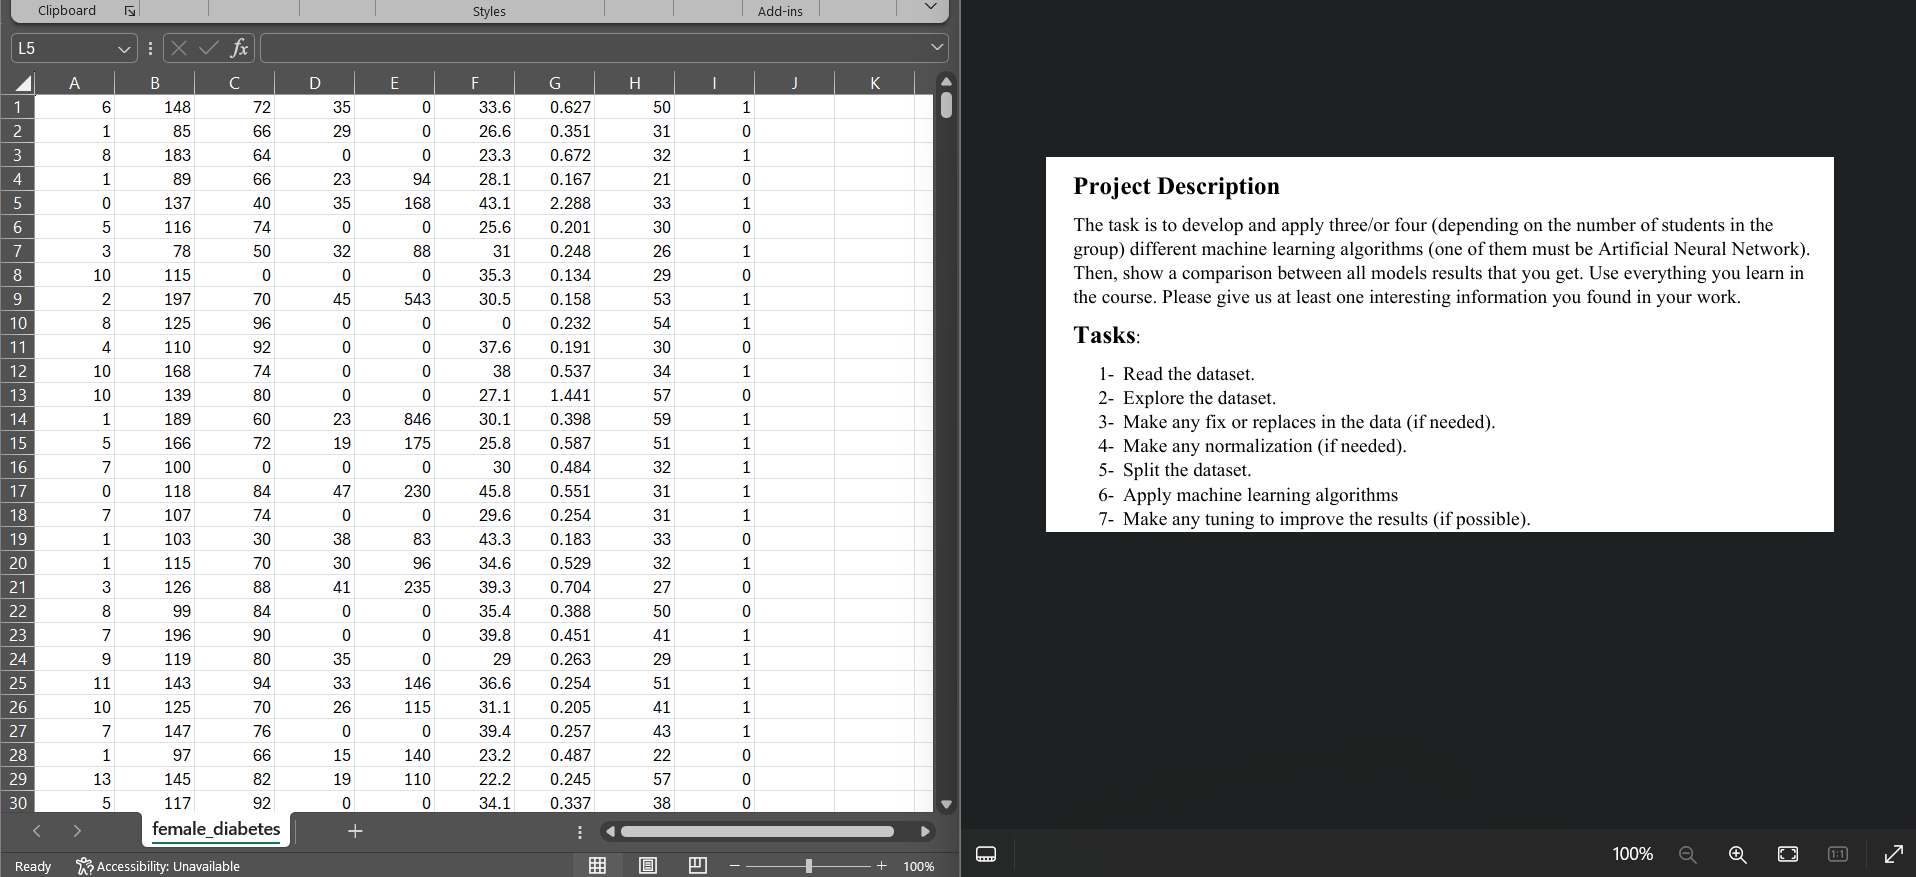
I have attached the requirements and part of the data
CODE:
import pandas as pd
# Assuming the dataset is in CSV format
df pdreadcsvpathtoyourfemalediabetes.csv
printdfhead # Display the first few rows
printdfinfo # Get info on data types and nonnull counts
printdfdescribe # Summary statistics
printdfisnullsum
dffillnadfmean inplaceTrue
from sklearn.preprocessing import StandardScaler
scaler StandardScaler
features dfiloc: : # All columns except the last one
scaledfeatures scaler.fittransformfeatures
dfiloc: : scaledfeatures
from sklearn.modelselection import traintestsplit
X dfiloc: : # Features
y dfiloc: # Labels
Xtrain, Xtest, ytrain, ytest traintestsplitX y testsize randomstate
from sklearn.linearmodel import LogisticRegression
from sklearn.metrics import accuracyscore, confusionmatrix, classificationreport, rocaucscore, roccurve, auc
model LogisticRegression
model.fitXtrain, ytrain
ypred model.predictXtest
yprob model.predictprobaXtest:
printLogistic Regression Accuracy:", accuracyscoreytest, ypred
printConfusion Matrix:
confusionmatrixytest, ypred
printClassification Report:
classificationreportytest, ypred
import matplotlib.pyplot as plt
import seaborn as sns
cm confusionmatrixytest, ypred
snsheatmapcm annotTrue, fmtd cmap'Blues'
pltxlabelPredicted
pltylabelTrue
plttitleConfusion Matrix Logistic Regression'
pltshow
fpr tpr thresholds roccurveytest, yprob
rocauc aucfpr tpr
pltfigure
pltplotfpr tpr color'darkorange', lw label'ROC curve area f rocauc
pltplot color'navy', lw linestyle
pltxlim
pltylim
pltxlabelFalse Positive Rate'
pltylabelTrue Positive Rate'
plttitleReceiver Operating Characteristic Logistic Regression'
pltlegendloc"lower right"
pltshow
Dataset :
Female Diabetes dataset contains records. It has features and one label for each record as
described below:
Number of times pregnant
Plasma glucose concentration a hours in an oral glucose tolerance test
Diastolic blood pressure mm Hg
Triceps skin fold thickness mm
Hour serum insulin mu Uml
Body mass index weight in kgheight in m
Diabetes pedigree function
Age years
Class variable has diabetes or has not diabetes

Step by Step Solution
There are 3 Steps involved in it
Step: 1

Get Instant Access to Expert-Tailored Solutions
See step-by-step solutions with expert insights and AI powered tools for academic success
Step: 2

Step: 3

Ace Your Homework with AI
Get the answers you need in no time with our AI-driven, step-by-step assistance
Get Started


