Answered step by step
Verified Expert Solution
Question
1 Approved Answer
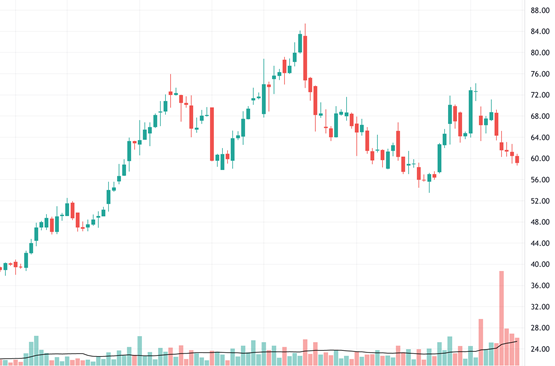
Identify a common chart pattern on the following stock price and volume chart (prices are the upper candlesticks, volume is the lower bar graph). Identify
Identify a common chart pattern on the following stock price and volume chart (prices are the upper candlesticks, volume is the lower bar graph). Identify directly on the chart any support and/or resistance, as well as any other key characteristics of the pattern. Based only on the identified pattern and the current price and volume action shown, would you buy this stock? Why?

Step by Step Solution
There are 3 Steps involved in it
Step: 1

Get Instant Access to Expert-Tailored Solutions
See step-by-step solutions with expert insights and AI powered tools for academic success
Step: 2

Step: 3

Ace Your Homework with AI
Get the answers you need in no time with our AI-driven, step-by-step assistance
Get Started


