

Answered step by step
Verified Expert Solution
Question
1 Approved Answer
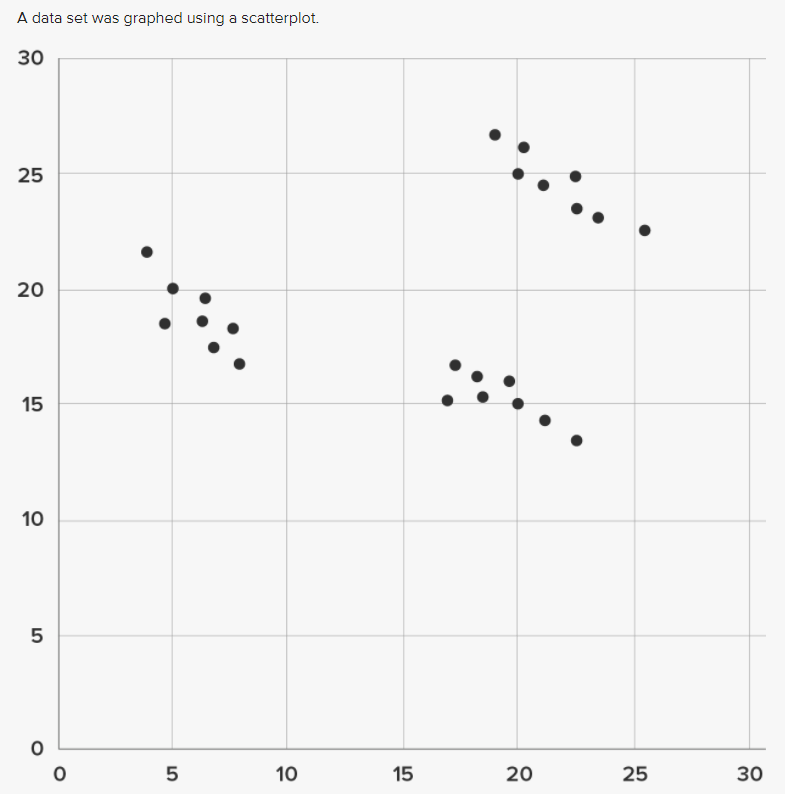
Identify non-linearity, influential point, or inappropriate grouping in a data set. A data set was graphed using a scatterplot. The correlation coefficient, r, is 0.192.
Identify non-linearity, influential point, or inappropriate grouping in a data set.
A data set was graphed using a scatterplot.
The correlation coefficient, r, is 0.192. Which of the following statements explains how the correlation is affected?
- a.)It is affected by an influential point.
- b.)It is affected by inappropriate grouping.
- c.)It is affected by non-linearity.
- d.)It is not affected
Step by Step Solution
There are 3 Steps involved in it
Step: 1

Get Instant Access to Expert-Tailored Solutions
See step-by-step solutions with expert insights and AI powered tools for academic success
Step: 2

Step: 3
Ace Your Homework with AI
Get the answers you need in no time with our AI-driven, step-by-step assistance
Get Started