Answered step by step
Verified Expert Solution
Link Copied!

Question

1 Approved Answer

Identify the highlighted chart pattern below: Pfizer Inc. PFE (NYSE) 1 Day Candlestick Chart- USD. No Layout . 42.00 41.00 40.00 39.00 38.00 37.00 36.00
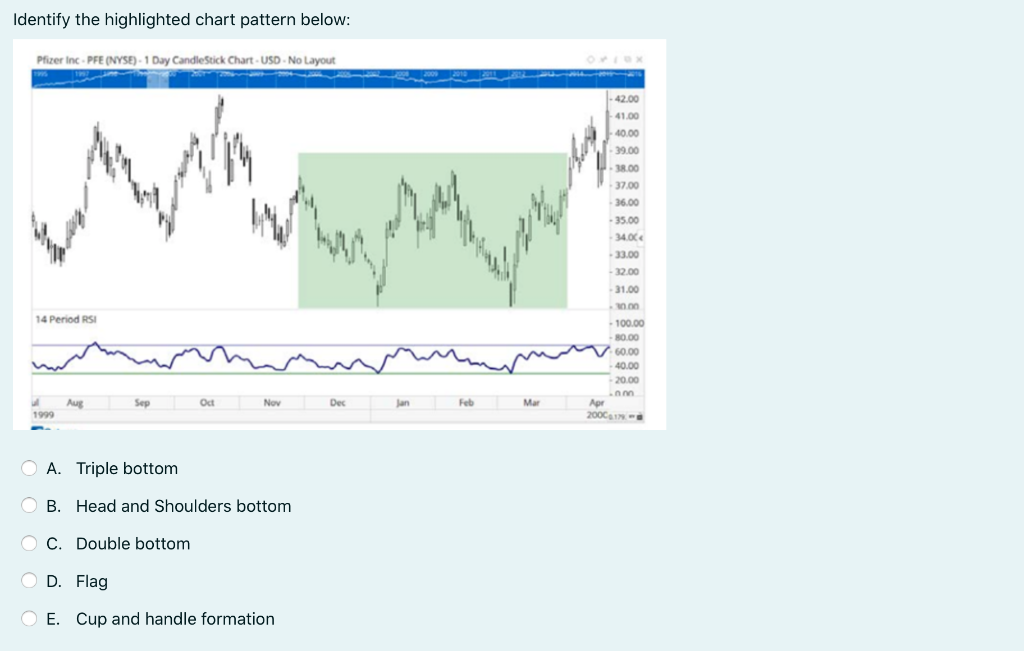
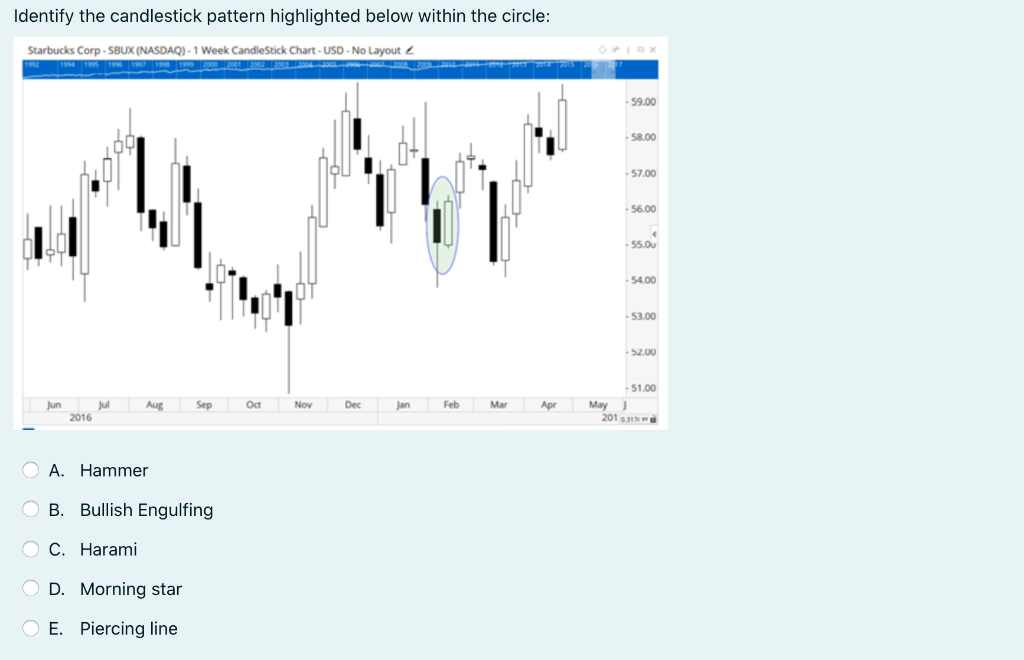
image text in transcribed

image text in transcribed

image text in transcribed

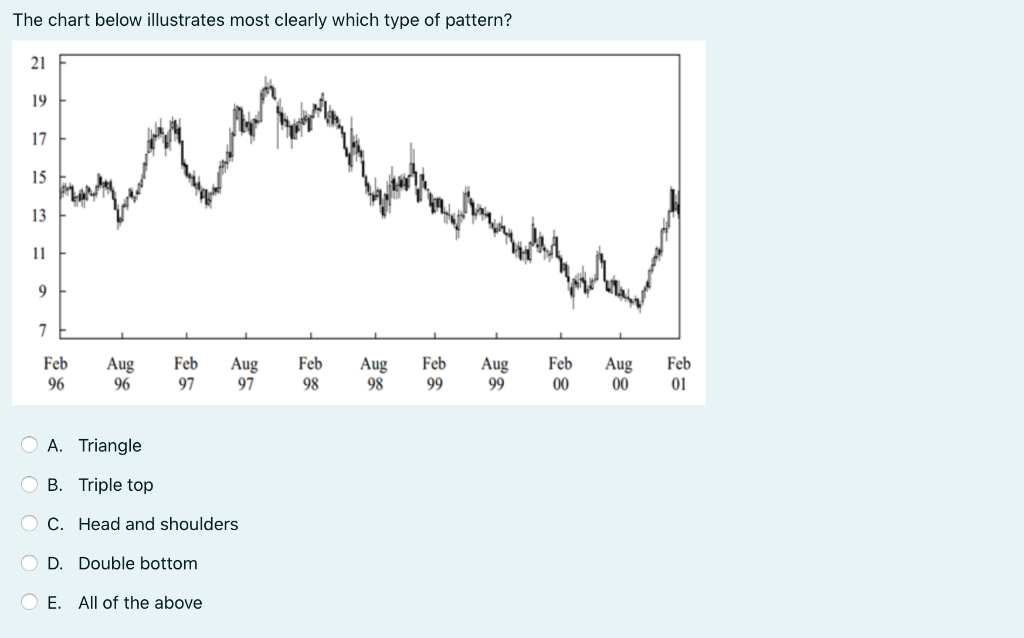
Identify the highlighted chart pattern below: Pfizer Inc. PFE (NYSE) 1 Day Candlestick Chart- USD. No Layout . 42.00 41.00 40.00 39.00 38.00 37.00 36.00 - 35.00 34.0% - 33,00 22.00 31.00 14 Period RSI 1000 - 100.00 80.00 60.00 40.00 20.00 . Apr Aug Oct Nov Dec Lan Feb Mar 1999 200CA- O A. Triple bottom O B. Head and Shoulders bottom O C. Double bottom O D. Flag O E. Cup and handle formation Identify the candlestick pattern highlighted below within the circle: Starbucks Corp-SBUX (NASDAQ) - 1 Week Candlestick Chart - USD - No Layout - 59.00 58.00 57.00 9 56.00 - 55.0 - 54.00 53.00 - 52.00 51.00 Jun Jul Aug Sep Oct Nov Dec Feb M Apr May 2016 2013 O A. Hammer B. Bullish Engulfing C. Harami O D. Morning star E. Piercing line The chart below illustrates most clearly which type of pattern? 21 19 17 15 13 11 9 7 Feb 96 Aug 96 Feb 97 Aug 97 Feb 98 Aug 98 Feb 99 Aug 99 Feb 00 Aug 00 Feb 01 O A. Triangle OB. Triple top OC. Head and shoulders O D. Double bottom O E. All of the above
Step by Step Solution

There are 3 Steps involved in it

Step: 1

blur-text-image

Get Instant Access to Expert-Tailored Solutions

See step-by-step solutions with expert insights and AI powered tools for academic success

Step: 2

blur-text-image

Step: 3

blur-text-image

Ace Your Homework with AI

Get the answers you need in no time with our AI-driven, step-by-step assistance

Get Started

Recommended Textbook for

Finance for Non Financial Managers

Authors: Pierre Bergeron

7th edition

176530835, 978-0176530839

More Books

Students also viewed these Finance questions