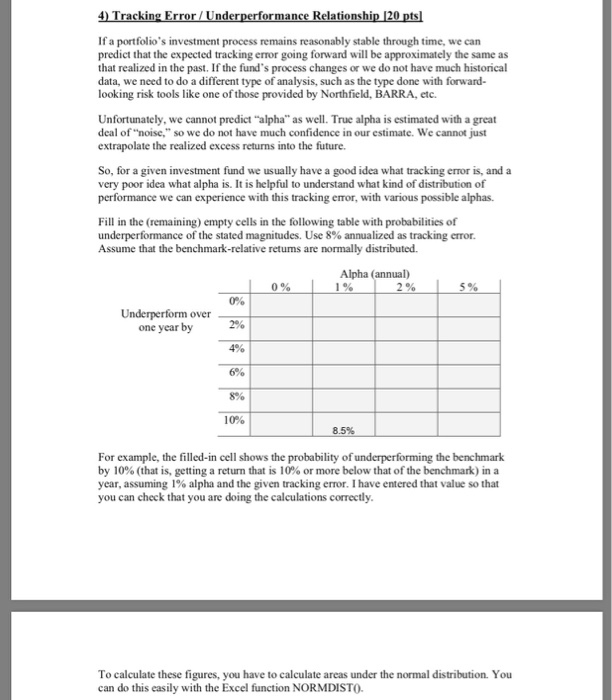
If a portfolio's investment process remains reasonably stable through time, we can predict that the expected tracking error going forward will be approximately the same as that realized in the past. If the fund's process changes or we do not have much historical data, we need to do a different type of analysis, such as the type done with forward- looking risk tools like one of those provided by Northfield, BARRA, etc. Unfortunately, we cannot predict "alpha" as well. True alpha is estimated with a great deal of noise," so we do not have much confidence in our estimate. We cannot just extrapolate the realized excess returns into the future. So, for a given investment fund we usually have a good idea what tracking error is, and a very poor idea what alpha is. It is helpful to understand what kind of distribution of performance we can experience with this tracking error, with various possible alphas. Fill in the (remaining) empty cells in the following table with probabilities of underperformance of the stated magnitudes. Use 8% annualized as tracking error. Assume that the benchmark-relative retums are normally distributed. Alpha (annual) 2% one year by 4% 6% 8% 10% For example, the filled-in cell shows the probability of underperforming the benchmark by 10% (that is, getting a return that is 10% or more below that of the benchmark) in a year, assuming 1% alpha and the given tracking error. I have entered that value so that you can check that you are doing the calculations correctly To calculate these figures, you have to calculate areas under the normal distribution. You can do this easily with the Excel function NORMDISTO If a portfolio's investment process remains reasonably stable through time, we can predict that the expected tracking error going forward will be approximately the same as that realized in the past. If the fund's process changes or we do not have much historical data, we need to do a different type of analysis, such as the type done with forward- looking risk tools like one of those provided by Northfield, BARRA, etc. Unfortunately, we cannot predict "alpha" as well. True alpha is estimated with a great deal of noise," so we do not have much confidence in our estimate. We cannot just extrapolate the realized excess returns into the future. So, for a given investment fund we usually have a good idea what tracking error is, and a very poor idea what alpha is. It is helpful to understand what kind of distribution of performance we can experience with this tracking error, with various possible alphas. Fill in the (remaining) empty cells in the following table with probabilities of underperformance of the stated magnitudes. Use 8% annualized as tracking error. Assume that the benchmark-relative retums are normally distributed. Alpha (annual) 2% one year by 4% 6% 8% 10% For example, the filled-in cell shows the probability of underperforming the benchmark by 10% (that is, getting a return that is 10% or more below that of the benchmark) in a year, assuming 1% alpha and the given tracking error. I have entered that value so that you can check that you are doing the calculations correctly To calculate these figures, you have to calculate areas under the normal distribution. You can do this easily with the Excel function NORMDISTO


