Answered step by step
Verified Expert Solution
Link Copied!

Question

1 Approved Answer

if u can plz use jupyter notebook to write this python code. that's the example code Task II: This task involves plotting the slope field

if u can plz use jupyter notebook to write this python code.

image text in transcribed

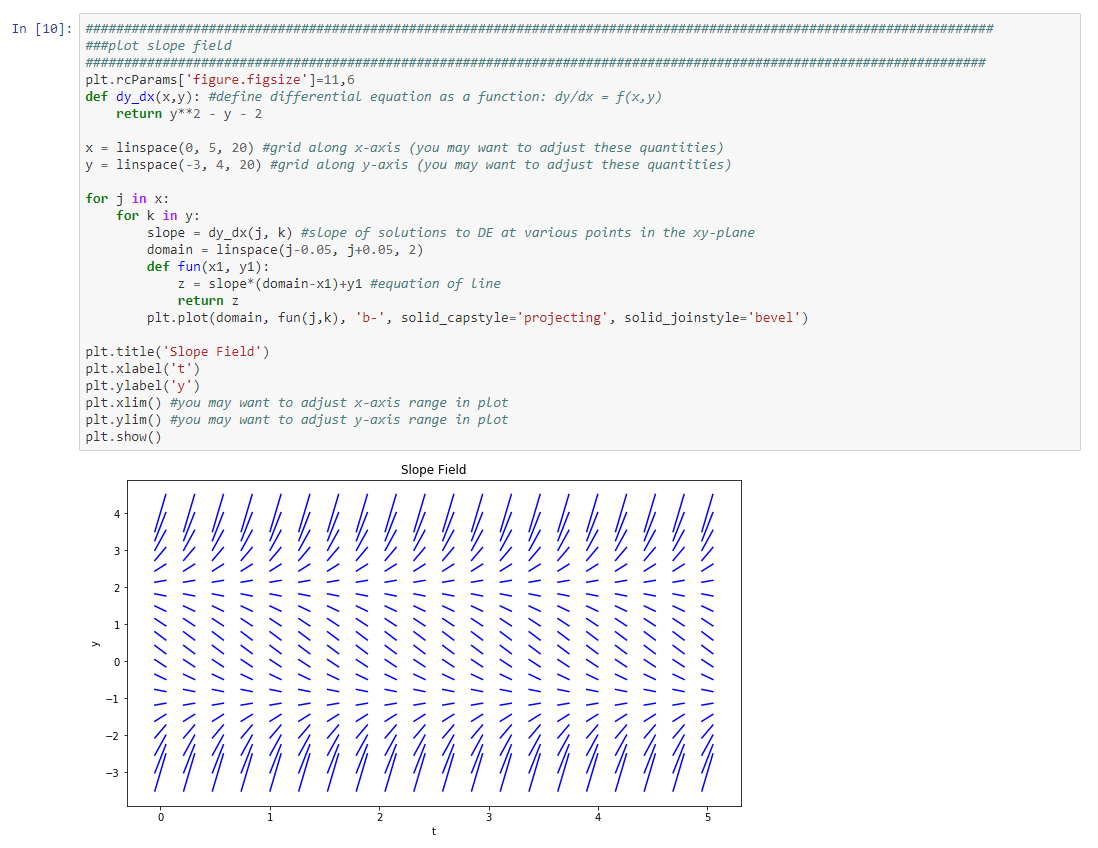
that's the example code

image text in transcribed

Task II: This task involves plotting the slope field of a first-oder differential equation. - Plot the slope field for the differntial equation y' = lny - t. Assume that t (-2, 2) and y [1,4]. Be sure to label the axes and give the plot a title. In [10]: ###################################################################################################################### ###plot slope field plt.rcParams['figure.figsize']=11,6 def dy_dx(x,y): #define differential equation as a function: dy/dx = f(x,y) return y**2 - y - 2 x = linspace(0, 5, 20) #grid along x-axis (you may want to adjust these quantities) y = linspace(-3, 4, 20) #grid along y-axis (you may want to adjust these quantities) for j in x: for k in y: slope = dy_dx(j, k) #slope of solutions to DE at various points in the xy-plane domain - linspace(-0.05, j+0.05, 2) def fun(x1, y1): z = slope* (domain-x1)+y1 #equation of Line return z plt.plot(domain, fun (j,k), 'b-', solid_capstyle='projecting', solid_joinstyle='bevel') plt.title('slope Field') plt.xlabel('t') plt.ylabel('y') plt.xlim() #you may want to adjust x-axis range in plot plt.ylim() #you may want to adjust y-axis range in plot plt.show() Slope Field 4 3 2 1 0 -1 0

Step by Step Solution

There are 3 Steps involved in it

Step: 1

blur-text-image

Get Instant Access to Expert-Tailored Solutions

See step-by-step solutions with expert insights and AI powered tools for academic success

Step: 2

blur-text-image_step_2

Step: 3

blur-text-image_step3

Ace Your Homework with AI

Get the answers you need in no time with our AI-driven, step-by-step assistance

Get Started

Students also viewed these Databases questions