Answered step by step
Verified Expert Solution
Link Copied!

Question

1 Approved Answer

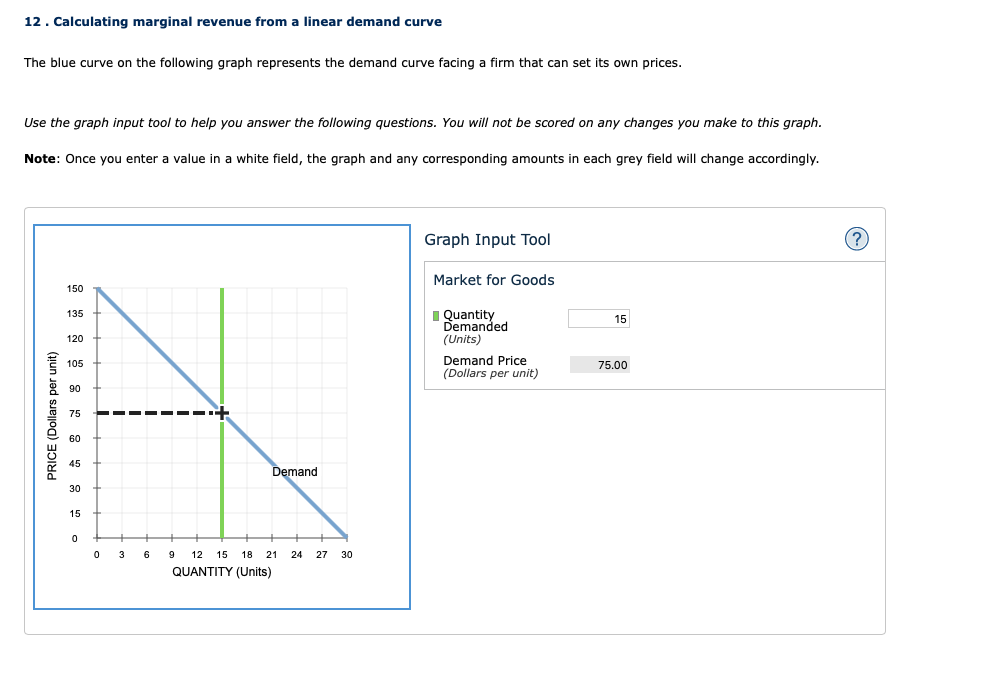
if yo need more information, please let me know. thank you so much. 12 . Calculating marginal revenue from a linear demand curve The blue

if yo need more information, please let me know. thank you so much.

image text in transcribedimage text in transcribedimage text in transcribedimage text in transcribed
12 . Calculating marginal revenue from a linear demand curve The blue curve on the following graph represents the demand curve facing a firm that can set its own prices. Use the graph input tool to help you answer the following questions. You will not be scored on any changes you make to this graph. Note: Once you enter a value in a white field, the graph and any corresponding amounts in each grey field will change accordingly. Graph Input Tool (? ) 150 Market for Goods 135 I Quantity 120 Demanded 15 (Units) PRICE (Dollars per unit) 105 Demand Price (Dollars per unit) 75.00 60 Demand 30 0 3 6 9 12 15 18 21 24 27 30 QUANTITY (Units)On the previous graph, change the number found in the Quantity Demanded field to determine the prices that correspond to the production of 0, 6, 12, 15, 18, 24, or 30 units of output. Calculate the total revenue for each of these production levels. Then, on the following graph, use the green points (triangle symbol) to plot the results. 1130 4 1017 904 Total Revenue TOTAL REVENUE (Dollars) 791 678 565 452 339 226 113 3 6 9 12 15 18 21 24 27 30 QUANTITY (Number of units)Calculate the total revenue if the firm produces 6 versus 5 units. Then, calculate the marginal revenue of the sixth unit produced. The marginal revenue of the sixth unit produced is $ Calculate the total revenue if the firm produces 12 versus 11 units. Then, calculate the marginal revenue of the 12th unit produced. The marginal revenue of the 12th unit produced is $Based on your answers from the previous question, and assuming that the marginal revenue curve is a straight line, use the black line (plus symbol) to plot the firm's marginal revenue curve on the following graph. (Round all values to the nearest increment of 30.) 150 + 120 Marginal Revenue MARGINAL REVENUE (Dollars) 90 60 30 0 30 3 6 9 12 15 18 21 24 27 30 QUANTITY (Units) Comparing your total revenue graph to your marginal revenue graph, you can see that when total revenue is decreasing, marginal revenue is

Step by Step Solution

There are 3 Steps involved in it

Step: 1

blur-text-image

Get Instant Access to Expert-Tailored Solutions

See step-by-step solutions with expert insights and AI powered tools for academic success

Step: 2

blur-text-image

Step: 3

blur-text-image

Ace Your Homework with AI

Get the answers you need in no time with our AI-driven, step-by-step assistance

Get Started

Recommended Textbook for

Managerial Economics A Problem-Solving Approach

Authors: Luke M. Froeb, Brain T. Mccann

2nd Edition

B00BTM8FK0

More Books

Students also viewed these Economics questions

Question

=+ 4. How can policymakers infl uence a nations saving rate?

Answered: 1 week ago