 If you analyzed the firm's solvency analysis, what is the major change of the firm's capital structure? What are the possible reason(s) that the company wants to do so? Is the firm really in trouble if one applied the Return on Asset to verify the performance of the firm? Is using this rate sufficient enough to verify the performance of the firm? Why or why not? Analyze the firm's profitability by using the ratios given in the text. Is this company improving its position for the shareholders? Why or why not?
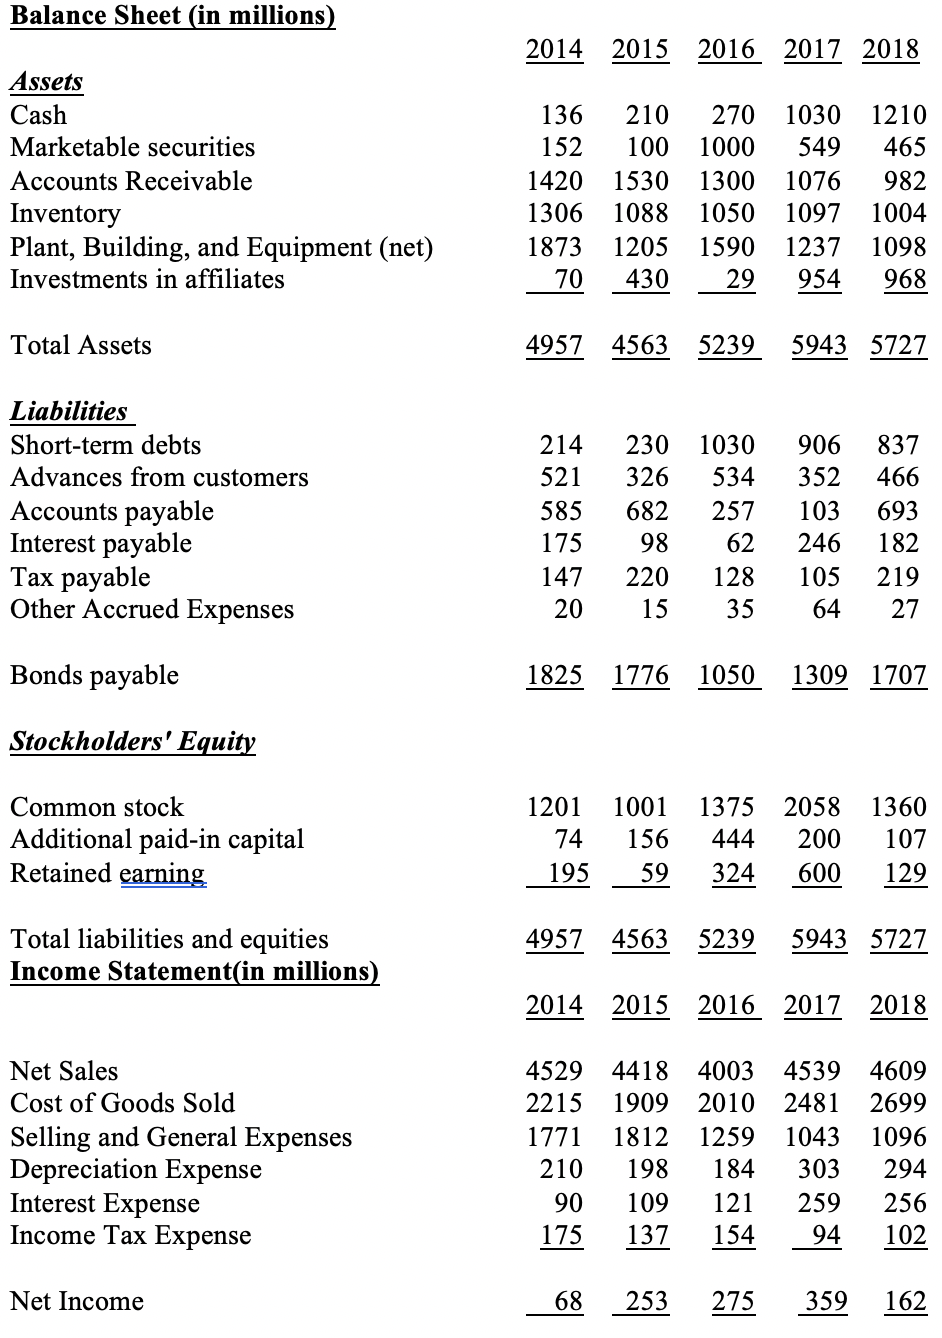
Balance Sheet (in millions) 2014 2015 2016 2017 2018 Assets Cash Marketable securities Accounts Receivable Inventory Plant, Building, and Equipment (net) Investments in affiliates 136 152 1420 1306 1873 70 210 100 1530 1088 1205 430 270 1000 1300 1050 1590 29 1030 549 1076 1097 1237 954 1210 465 982 1004 1098 968 Total Assets 4957 4563 5239 5943 5727 230 Liabilities Short-term debts Advances from customers Accounts payable Interest payable Tax payable Other Accrued Expenses 214 521 585 175 147 20 326 682 98 220 15 1030 534 257 62 128 35 906 352 103 246 105 64 837 466 693 182 219 27 Bonds payable 1825 1776 1050 1309 1707 Stockholders' Equity Common stock Additional paid-in capital Retained earning 1201 74 195 1001 156 59 1375 444 324 2058 200 600 1360 107 129 4957 4563 5239 5943 5727 Total liabilities and equities Income Statement(in millions) 2014 2015 2016 2017 2018 Net Sales Cost of Goods Sold Selling and General Expenses Depreciation Expense Interest Expense Income Tax Expense 4529 2215 1771 210 90 175 4418 4003 1909 2010 1812 1259 198 184 109 121 137 154 4539 2481 1043 303 259 94 4609 2699 1096 294 256 102 Net Income 68 68 253 275 359 162 Balance Sheet (in millions) 2014 2015 2016 2017 2018 Assets Cash Marketable securities Accounts Receivable Inventory Plant, Building, and Equipment (net) Investments in affiliates 136 152 1420 1306 1873 70 210 100 1530 1088 1205 430 270 1000 1300 1050 1590 29 1030 549 1076 1097 1237 954 1210 465 982 1004 1098 968 Total Assets 4957 4563 5239 5943 5727 230 Liabilities Short-term debts Advances from customers Accounts payable Interest payable Tax payable Other Accrued Expenses 214 521 585 175 147 20 326 682 98 220 15 1030 534 257 62 128 35 906 352 103 246 105 64 837 466 693 182 219 27 Bonds payable 1825 1776 1050 1309 1707 Stockholders' Equity Common stock Additional paid-in capital Retained earning 1201 74 195 1001 156 59 1375 444 324 2058 200 600 1360 107 129 4957 4563 5239 5943 5727 Total liabilities and equities Income Statement(in millions) 2014 2015 2016 2017 2018 Net Sales Cost of Goods Sold Selling and General Expenses Depreciation Expense Interest Expense Income Tax Expense 4529 2215 1771 210 90 175 4418 4003 1909 2010 1812 1259 198 184 109 121 137 154 4539 2481 1043 303 259 94 4609 2699 1096 294 256 102 Net Income 68 68 253 275 359 162