Answered step by step
Verified Expert Solution
Link Copied!

Question

1 Approved Answer

If you use Excel for any part of this problem, please perform all analysis in Sheet? of .xlsx. 1. Run the appropriate analysis to investigate
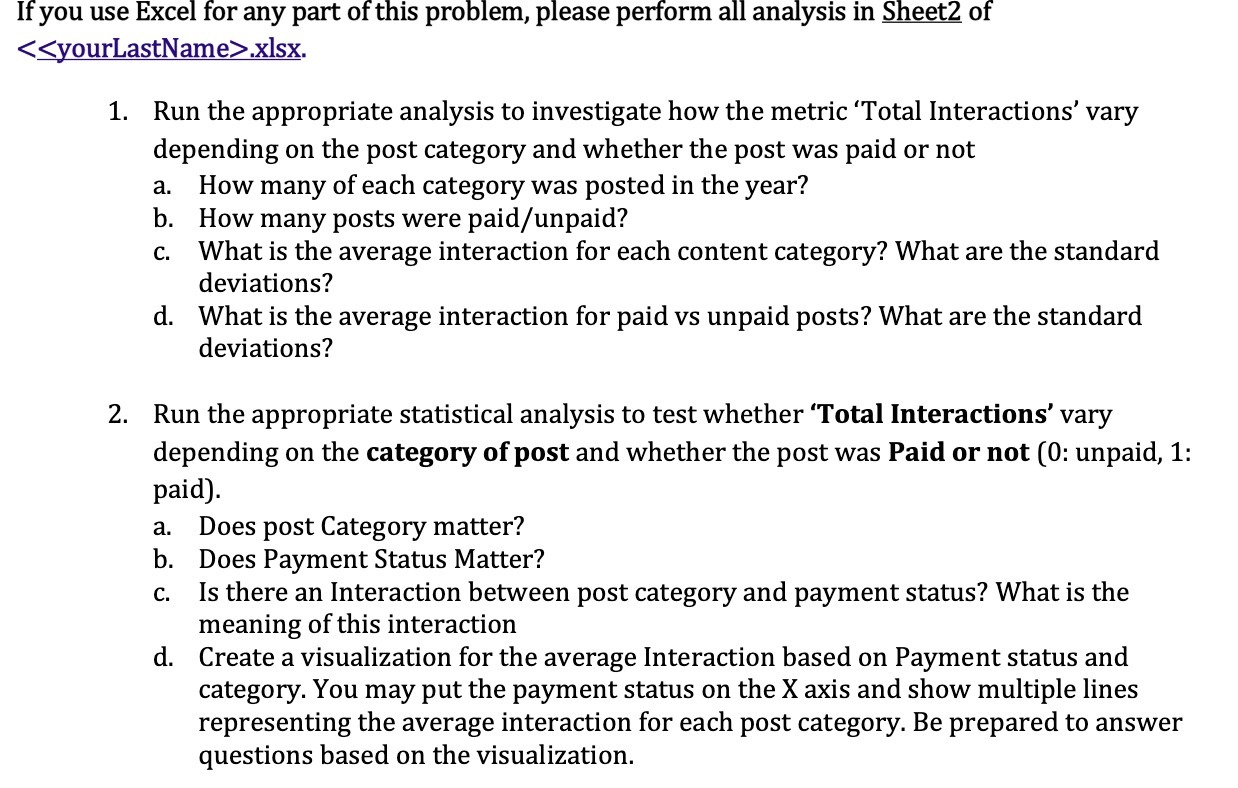
image text in transcribed
If you use Excel for any part of this problem, please perform all analysis in Sheet? of .xlsx. 1. Run the appropriate analysis to investigate how the metric 'Total Interactions' vary depending on the post category and whether the post was paid or not a. b. C. d. How many of each category was posted in the year? How many posts were paid/unpaid? What is the average interaction for each content category? What are the standard deviations? What is the average interaction for paid vs unpaid posts? What are the standard deviations? 2. Run the appropriate statistical analysis to test whether 'Total Interactions' vary depending on the category of post and Whether the post was Paid or not (0: unpaid, 1: paid). a. b. c. Does post Category matter? Does Payment Status Matter? Is there an Interaction between post category and payment status? What is the meaning of this interaction Create a visualization for the average Interaction based on Payment status and category. You may put the payment status on the X axis and show multiple lines representing the average interaction for each post category. Be prepared to answer questions based on the visualization

Step by Step Solution

There are 3 Steps involved in it

Step: 1

blur-text-image

Get Instant Access to Expert-Tailored Solutions

See step-by-step solutions with expert insights and AI powered tools for academic success

Step: 2

blur-text-image

Step: 3

blur-text-image

Ace Your Homework with AI

Get the answers you need in no time with our AI-driven, step-by-step assistance

Get Started

Recommended Textbook for

Elementary Algebra

Authors: Charles P McKeague

2nd Edition

ISBN: 1483263819, 9781483263816

More Books

Students also viewed these Mathematics questions