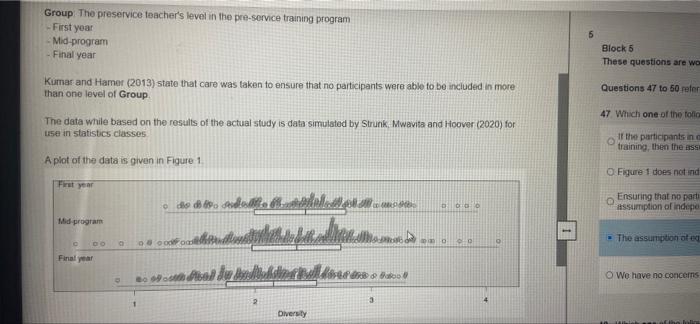
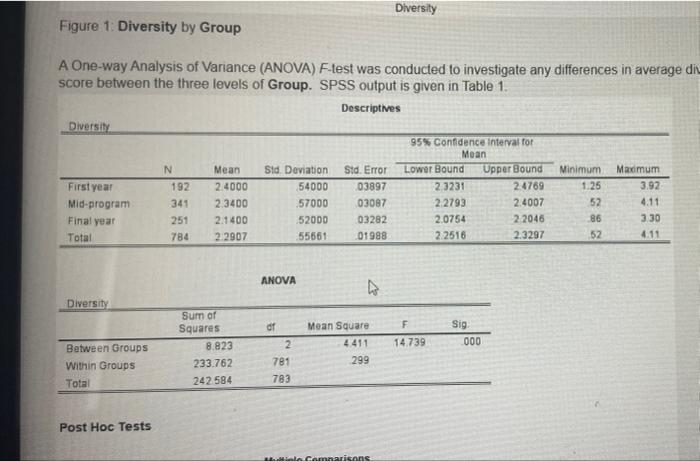
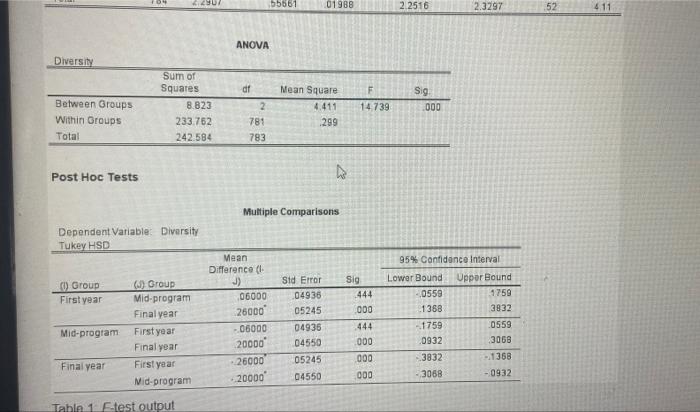
ignore the very first picture i sent - just zoom into the other 3
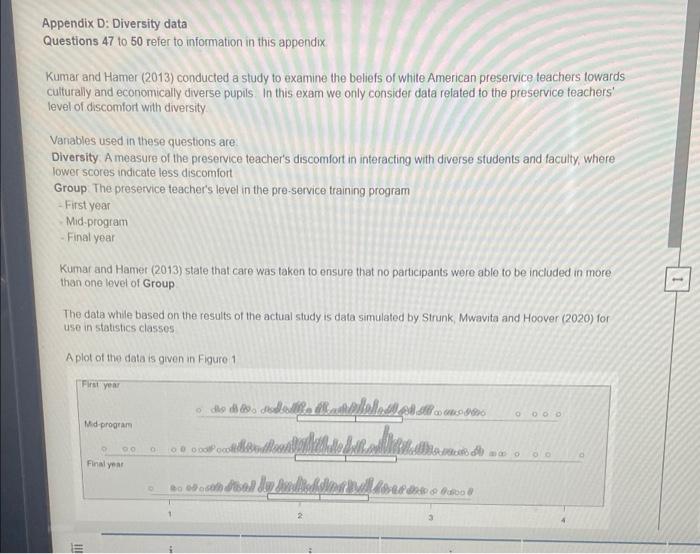
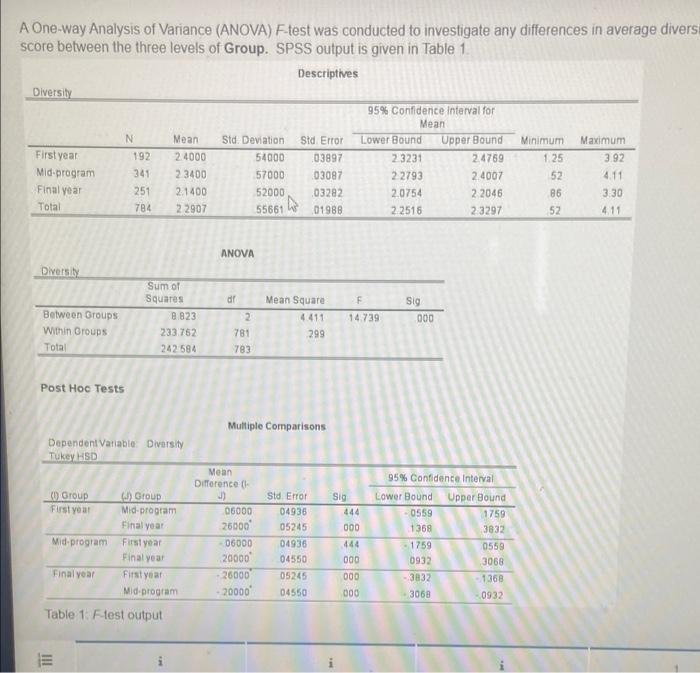
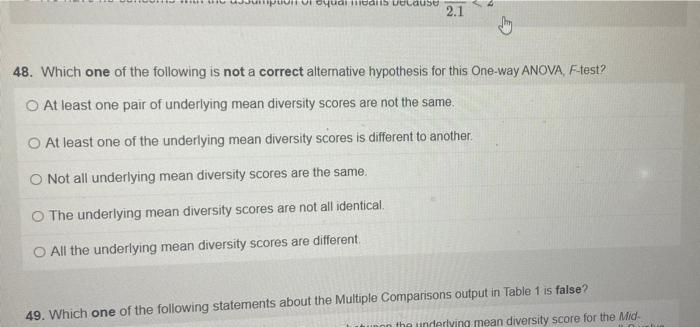
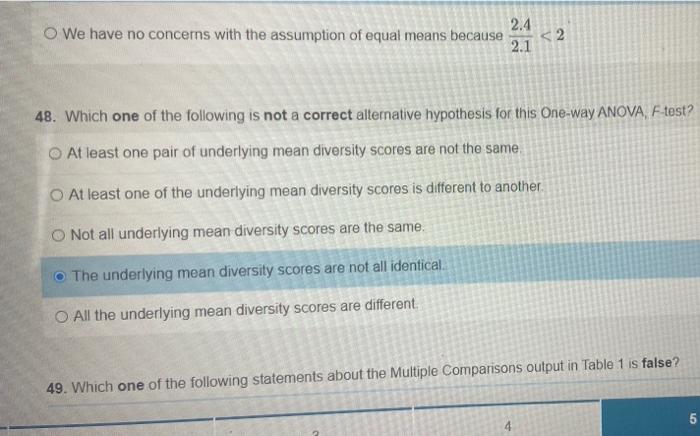
27 deng Appendix A Shaping Business Data Questis 21 25 The Mch 2005 2res run the Shaping Busudy, which survey and sample 1000 d binnes Some if valido pel APAR 20% of Babes Bus who ha oplys ges es reported! code is under a proth, undermen 40-0 toget Faders who h ning paig te who sched do fest pess 1 sudut, ce On the proces la gen O E Le P and IN IN t-procedures Single proportion p 0.82 n 1000 U ARE NOTEIKTI SOME hat he and busnesses beseve that on tus tres a of the feet coa on For 21 de acee 25th one of the best the propodot uses and savyod that hehtyr edhe me pas ng sand sandr saved that highlight and in the portate asist into the portant and larg htt olanthe p g) 3 sapte and com 15% 866 0000 politan 00 !!! Mid-program 90 Final year a 100 000 Bon disally audich D 1 A One-way Analysis of Variance (ANOVA) F-test was conducted to investigate any differences in average diversi score between the three levels of Group. SPSS output is given in Table 1. Descriptives Diversity 95% Confidence interval for Mean N Meant Std. Deviation Std. Error Lower Bound Upper Bound Minimum Maximum 2.4000 54000 03897 2.3231 2.4769 1.25 3.92 2.3400 57000 03087 2:2793 2.4007 52 4.11 2.1400 52000 03282 2.0754 2,2046 86 3.30 22907 55661 01988 2.2516 2:3297 52 4.11 First year Mid-program Final year Total Diversity Between Groups 8.823 Within Groups. 233.762 Total 242 584 Post Hoc Tests Dependent Variable: Diversity Tukey HSD (1) Group Group First year Mid-program Final year Mid-program First year Final year Final year First year Mid-program Table 1: F-test output III 192 341 251 784 Sum of Squares ANOVA Mean Square 4.411 781 299 783 Multiple Comparisons Std Error 04936 05245 04936 04550 05245 04550 2 Mean Difference ( J 06000 26000 06000 20000 26000 20000 Sig F 14.739 Sig 000 95% Confidence Interval Lower Bound Upper Bound -0559 1759 1368 3832 -1759 0559 0932 3068 -3832 -1368 3068 -0932 444 000 444 000 000 000 un equal means because 2.1 Jy 48. Which one of the following is not a correct alternative hypothesis for this One-way ANOVA, F-test? O At least one pair of underlying mean diversity scores are not the same. O At least one of the underlying mean diversity scores is different to another. O Not all underlying mean diversity scores are the same. O The underlying mean diversity scores are not all identical. O All the underlying mean diversity scores are different. 49. Which one of the following statements about the Multiple Comparisons output in Table 1 is false? the underlying mean diversity score for the Mid- lun 15 minutes remaining Appendix D: Diversity data Questions 47 to 50 refer to information in this appendix Kumar and Hamer (2013) conducted a study to examine the beliefs of white American preservice teachers towards culturally and economically diverse pupils. In this exam we only consider data related to the preservice teachers' level of discomfort with diversity. Variables used in these questions are: Diversity. A measure of the preservice teacher's discomfort in interacting with diverse students and faculty, where lower scores indicate less discomfort Group. The preservice teacher's level in the pre-service training program First year Mid-program - Final year Kumar and Hamer (2013) state that care was taken to ensure that no participants were able to be included in more than one level of Group The data while based on the results of the actual study is data simulated by Strunk, Mwavita and Hoover (2020) for use in statistics classes. Group The preservice teacher's level in the pre-service training program -First year -Mid-program - Final year Kumar and Hamer (2013) state that care was taken to ensure that no participants were able to be included in more than one level of Group The data while based on the results of the actual study is data simulated by Strunk, Mwavita and Hoover (2020) for use in statistics classes A plot of the data is given in Figure 1. First year DOGO o de ato sodelo Anat Mid-program ader diventando fit alttius um n C DO Final year 3 2 Diversity oood oat **00 1 5 Block 5 These questions are wor Questions 47 to 50 refer 47 Which one of the follo If the participants in a training, then the assi O Figure 1 does not indi O Ensuring that no parti assumption of indepe The assumption of eq O We have no concerns Diversity Figure 1: Diversity by Group A One-way Analysis of Variance (ANOVA) F-test was conducted to investigate any differences in average di score between the three levels of Group. SPSS output is given in Table 1. Descriptives Diversity 95% Confidence interval for Moan Upper Bound N Std. Deviation Std. Error Lower Bound Mean 2.4000 Minimum Maximum 1.25 First year 54000 03897 2.3231 24769 3.92 Mid-program 2.3400 57000 03087 2.2793 2.4007 52 4.11 2.1400 52000 03282 2.0754 22046 86 3.30 Final year Total 2:2907 55661 01988 2.2516 2.3297 52 4.11 4 Diversity Between Groups Within Groups Total Post Hoc Tests 192 341 251 784 Sum of Squares 8.823 233.762 242 584 ANOVA df 2 781 783 Mean Square 4.411 299 mparisons. F 14.739 Sig. 000 104 4.2907 Diversity Between Groups Within Groups Total Post Hoc Tests Dependent Variable: Diversity Tukey HSD (1) Group (3) Group First year Mid-program Final year First year Mid-program Final year First year Final year Mid-program Table 1 E-test output Sum of Squares 8.823 233.762 242.584 ANOVA df 2 Mean Difference ( J) 06000 55661 781 783 Multiple Comparisons Std Error 04936 05245 04936 04550 05245 04550 26000 -06000 20000 26000 20000 01988 Mean Square 4.411 299 k F 14,739 Sig 444 000 444 000 000 000 2.2516 Sig 2.3297 000 95% Confidence Intervall Upper Bound 1759 3832 0559 3068 1368 - 0932 Lower Bound 0559 1368 -1759 0932 3832 3068 52 411 O We have no concerns with the assumption of equal means because 2.4 866 0000 politan 00 !!! Mid-program 90 Final year a 100 000 Bon disally audich D 1 A One-way Analysis of Variance (ANOVA) F-test was conducted to investigate any differences in average diversi score between the three levels of Group. SPSS output is given in Table 1. Descriptives Diversity 95% Confidence interval for Mean N Meant Std. Deviation Std. Error Lower Bound Upper Bound Minimum Maximum 2.4000 54000 03897 2.3231 2.4769 1.25 3.92 2.3400 57000 03087 2:2793 2.4007 52 4.11 2.1400 52000 03282 2.0754 2,2046 86 3.30 22907 55661 01988 2.2516 2:3297 52 4.11 First year Mid-program Final year Total Diversity Between Groups 8.823 Within Groups. 233.762 Total 242 584 Post Hoc Tests Dependent Variable: Diversity Tukey HSD (1) Group Group First year Mid-program Final year Mid-program First year Final year Final year First year Mid-program Table 1: F-test output III 192 341 251 784 Sum of Squares ANOVA Mean Square 4.411 781 299 783 Multiple Comparisons Std Error 04936 05245 04936 04550 05245 04550 2 Mean Difference ( J 06000 26000 06000 20000 26000 20000 Sig F 14.739 Sig 000 95% Confidence Interval Lower Bound Upper Bound -0559 1759 1368 3832 -1759 0559 0932 3068 -3832 -1368 3068 -0932 444 000 444 000 000 000 un equal means because 2.1 Jy 48. Which one of the following is not a correct alternative hypothesis for this One-way ANOVA, F-test? O At least one pair of underlying mean diversity scores are not the same. O At least one of the underlying mean diversity scores is different to another. O Not all underlying mean diversity scores are the same. O The underlying mean diversity scores are not all identical. O All the underlying mean diversity scores are different. 49. Which one of the following statements about the Multiple Comparisons output in Table 1 is false? the underlying mean diversity score for the Mid- lun 15 minutes remaining Appendix D: Diversity data Questions 47 to 50 refer to information in this appendix Kumar and Hamer (2013) conducted a study to examine the beliefs of white American preservice teachers towards culturally and economically diverse pupils. In this exam we only consider data related to the preservice teachers' level of discomfort with diversity. Variables used in these questions are: Diversity. A measure of the preservice teacher's discomfort in interacting with diverse students and faculty, where lower scores indicate less discomfort Group. The preservice teacher's level in the pre-service training program First year Mid-program - Final year Kumar and Hamer (2013) state that care was taken to ensure that no participants were able to be included in more than one level of Group The data while based on the results of the actual study is data simulated by Strunk, Mwavita and Hoover (2020) for use in statistics classes. Group The preservice teacher's level in the pre-service training program -First year -Mid-program - Final year Kumar and Hamer (2013) state that care was taken to ensure that no participants were able to be included in more than one level of Group The data while based on the results of the actual study is data simulated by Strunk, Mwavita and Hoover (2020) for use in statistics classes A plot of the data is given in Figure 1. First year DOGO o de ato sodelo Anat Mid-program ader diventando fit alttius um n C DO Final year 3 2 Diversity oood oat **00 1 5 Block 5 These questions are wor Questions 47 to 50 refer 47 Which one of the follo If the participants in a training, then the assi O Figure 1 does not indi O Ensuring that no parti assumption of indepe The assumption of eq O We have no concerns Diversity Figure 1: Diversity by Group A One-way Analysis of Variance (ANOVA) F-test was conducted to investigate any differences in average di score between the three levels of Group. SPSS output is given in Table 1. Descriptives Diversity 95% Confidence interval for Moan Upper Bound N Std. Deviation Std. Error Lower Bound Mean 2.4000 Minimum Maximum 1.25 First year 54000 03897 2.3231 24769 3.92 Mid-program 2.3400 57000 03087 2.2793 2.4007 52 4.11 2.1400 52000 03282 2.0754 22046 86 3.30 Final year Total 2:2907 55661 01988 2.2516 2.3297 52 4.11 4 Diversity Between Groups Within Groups Total Post Hoc Tests 192 341 251 784 Sum of Squares 8.823 233.762 242 584 ANOVA df 2 781 783 Mean Square 4.411 299 mparisons. F 14.739 Sig. 000 104 4.2907 Diversity Between Groups Within Groups Total Post Hoc Tests Dependent Variable: Diversity Tukey HSD (1) Group (3) Group First year Mid-program Final year First year Mid-program Final year First year Final year Mid-program Table 1 E-test output Sum of Squares 8.823 233.762 242.584 ANOVA df 2 Mean Difference ( J) 06000 55661 781 783 Multiple Comparisons Std Error 04936 05245 04936 04550 05245 04550 26000 -06000 20000 26000 20000 01988 Mean Square 4.411 299 k F 14,739 Sig 444 000 444 000 000 000 2.2516 Sig 2.3297 000 95% Confidence Intervall Upper Bound 1759 3832 0559 3068 1368 - 0932 Lower Bound 0559 1368 -1759 0932 3832 3068 52 411 O We have no concerns with the assumption of equal means because 2.4
