Answered step by step
Verified Expert Solution
Question
1 Approved Answer
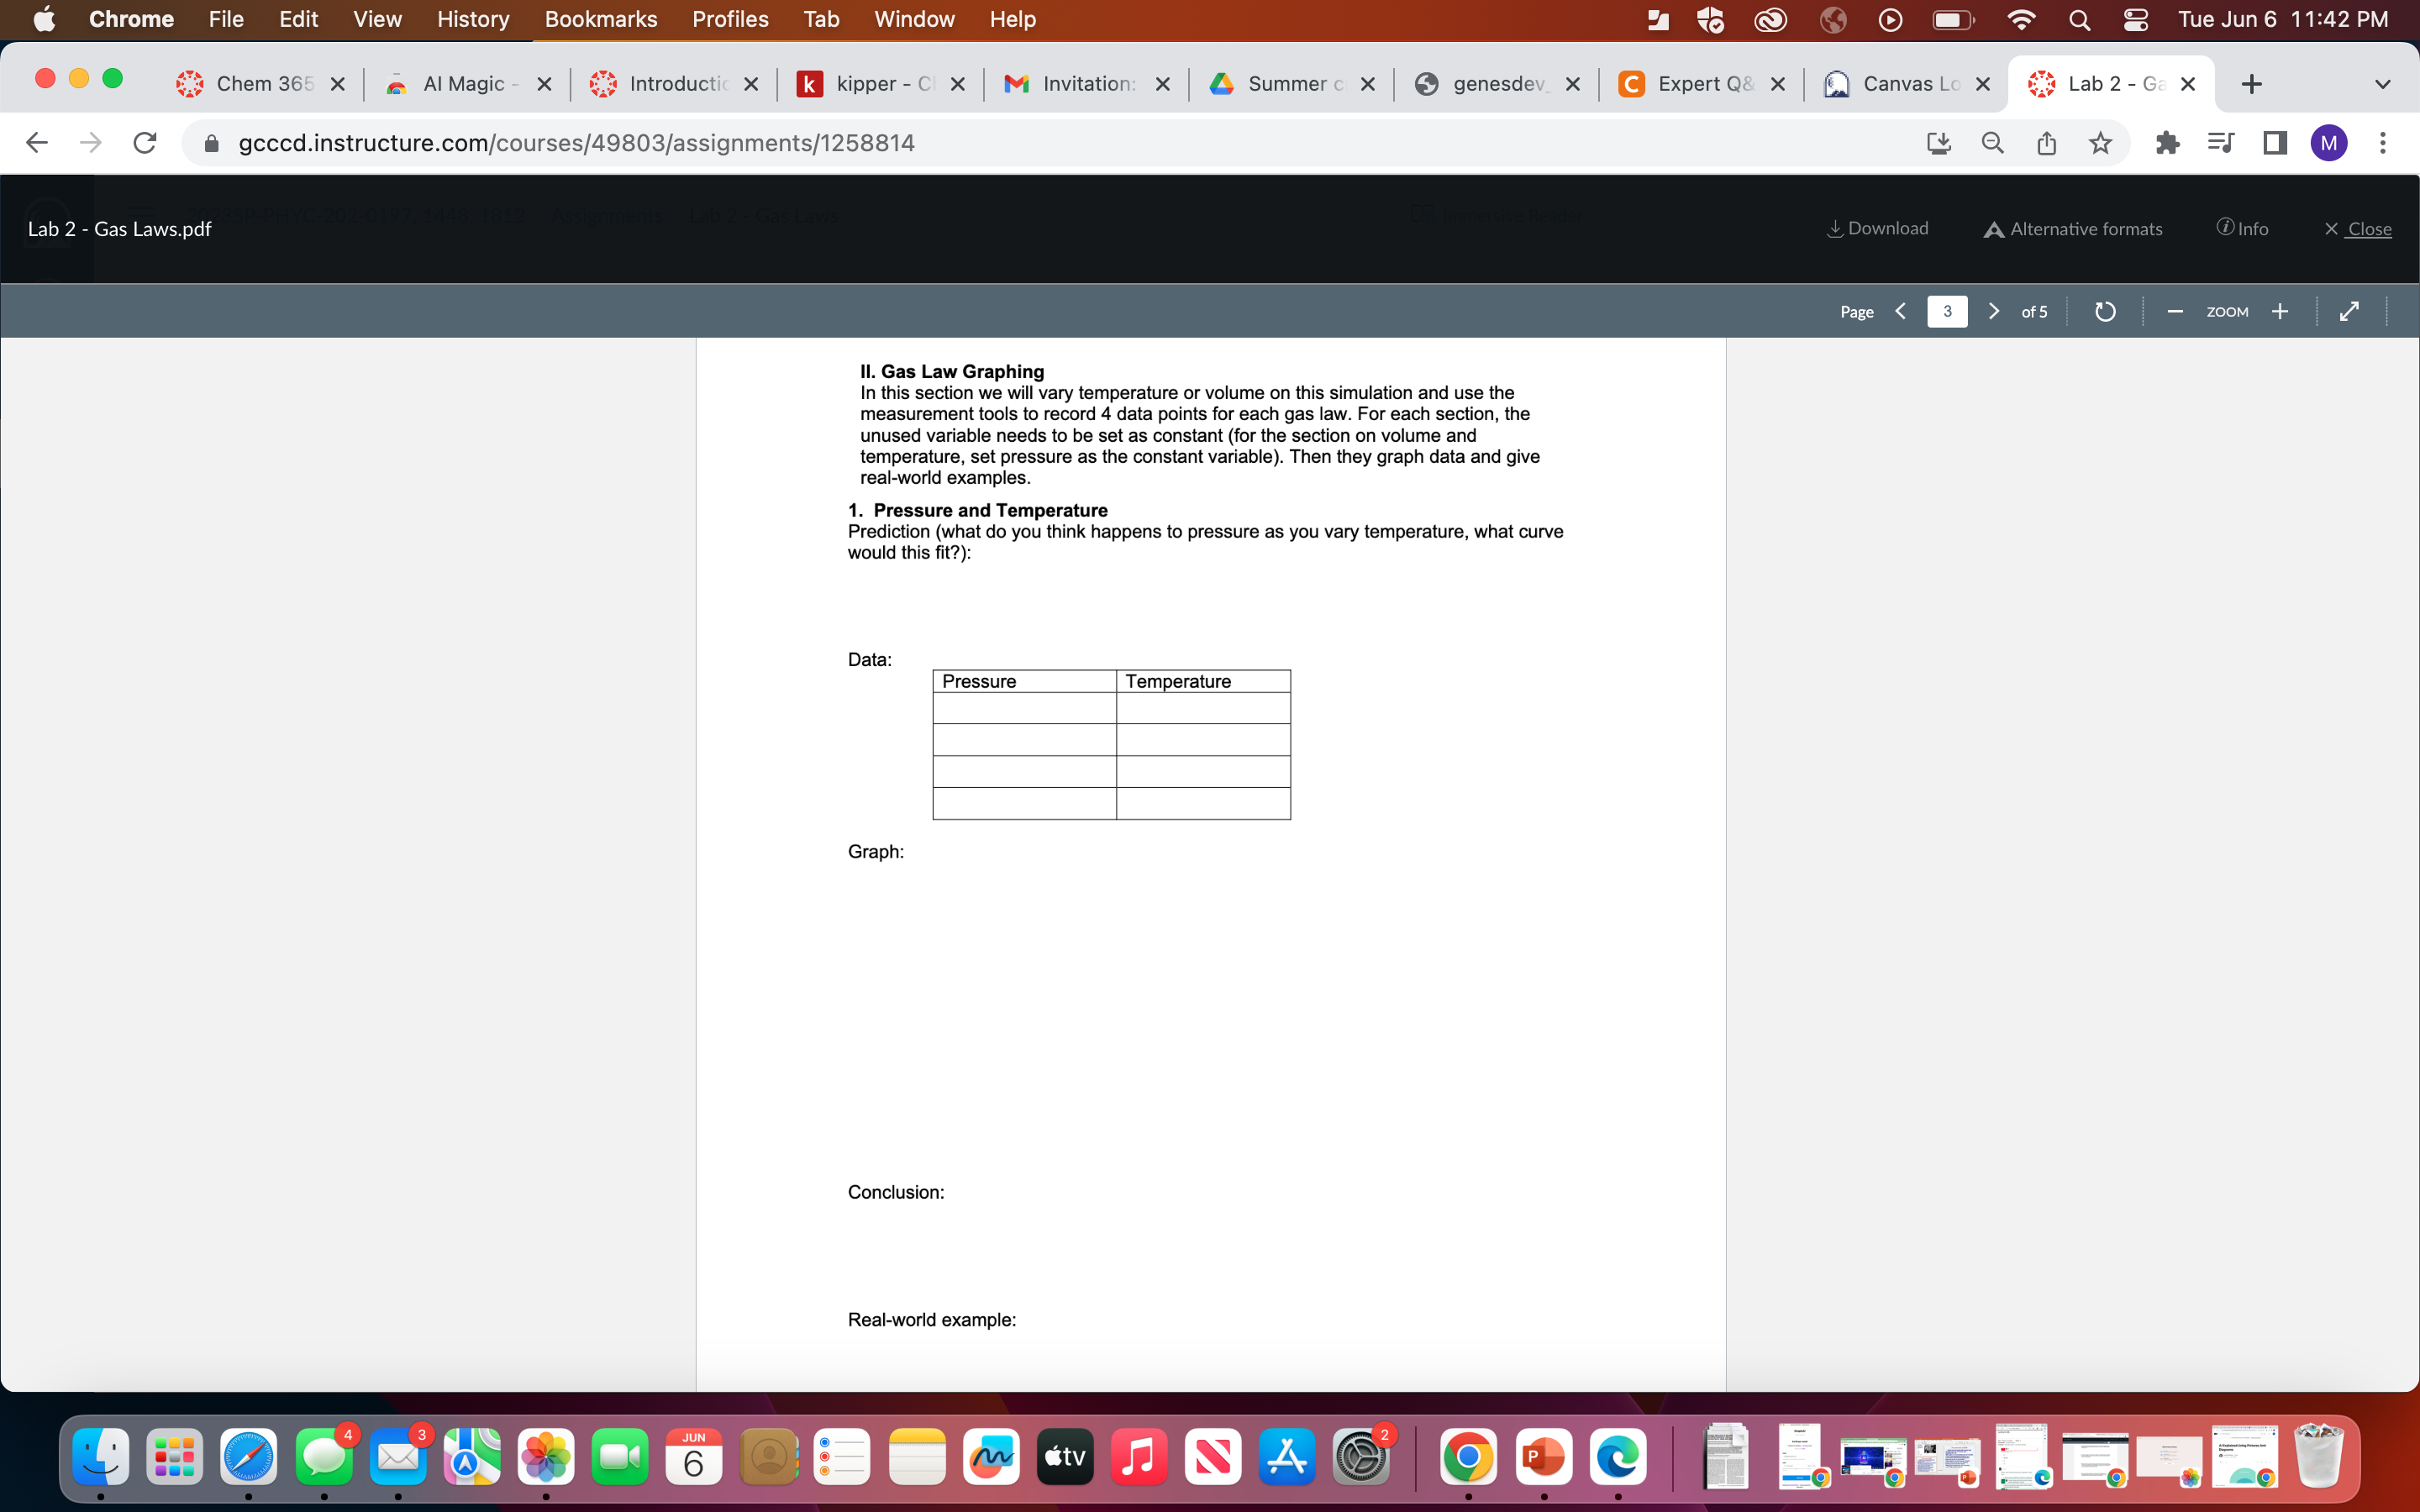
II. Gas Law Graphing In this section we will vary temperature or volume on this simulation and use the measurement tools to record 4 data


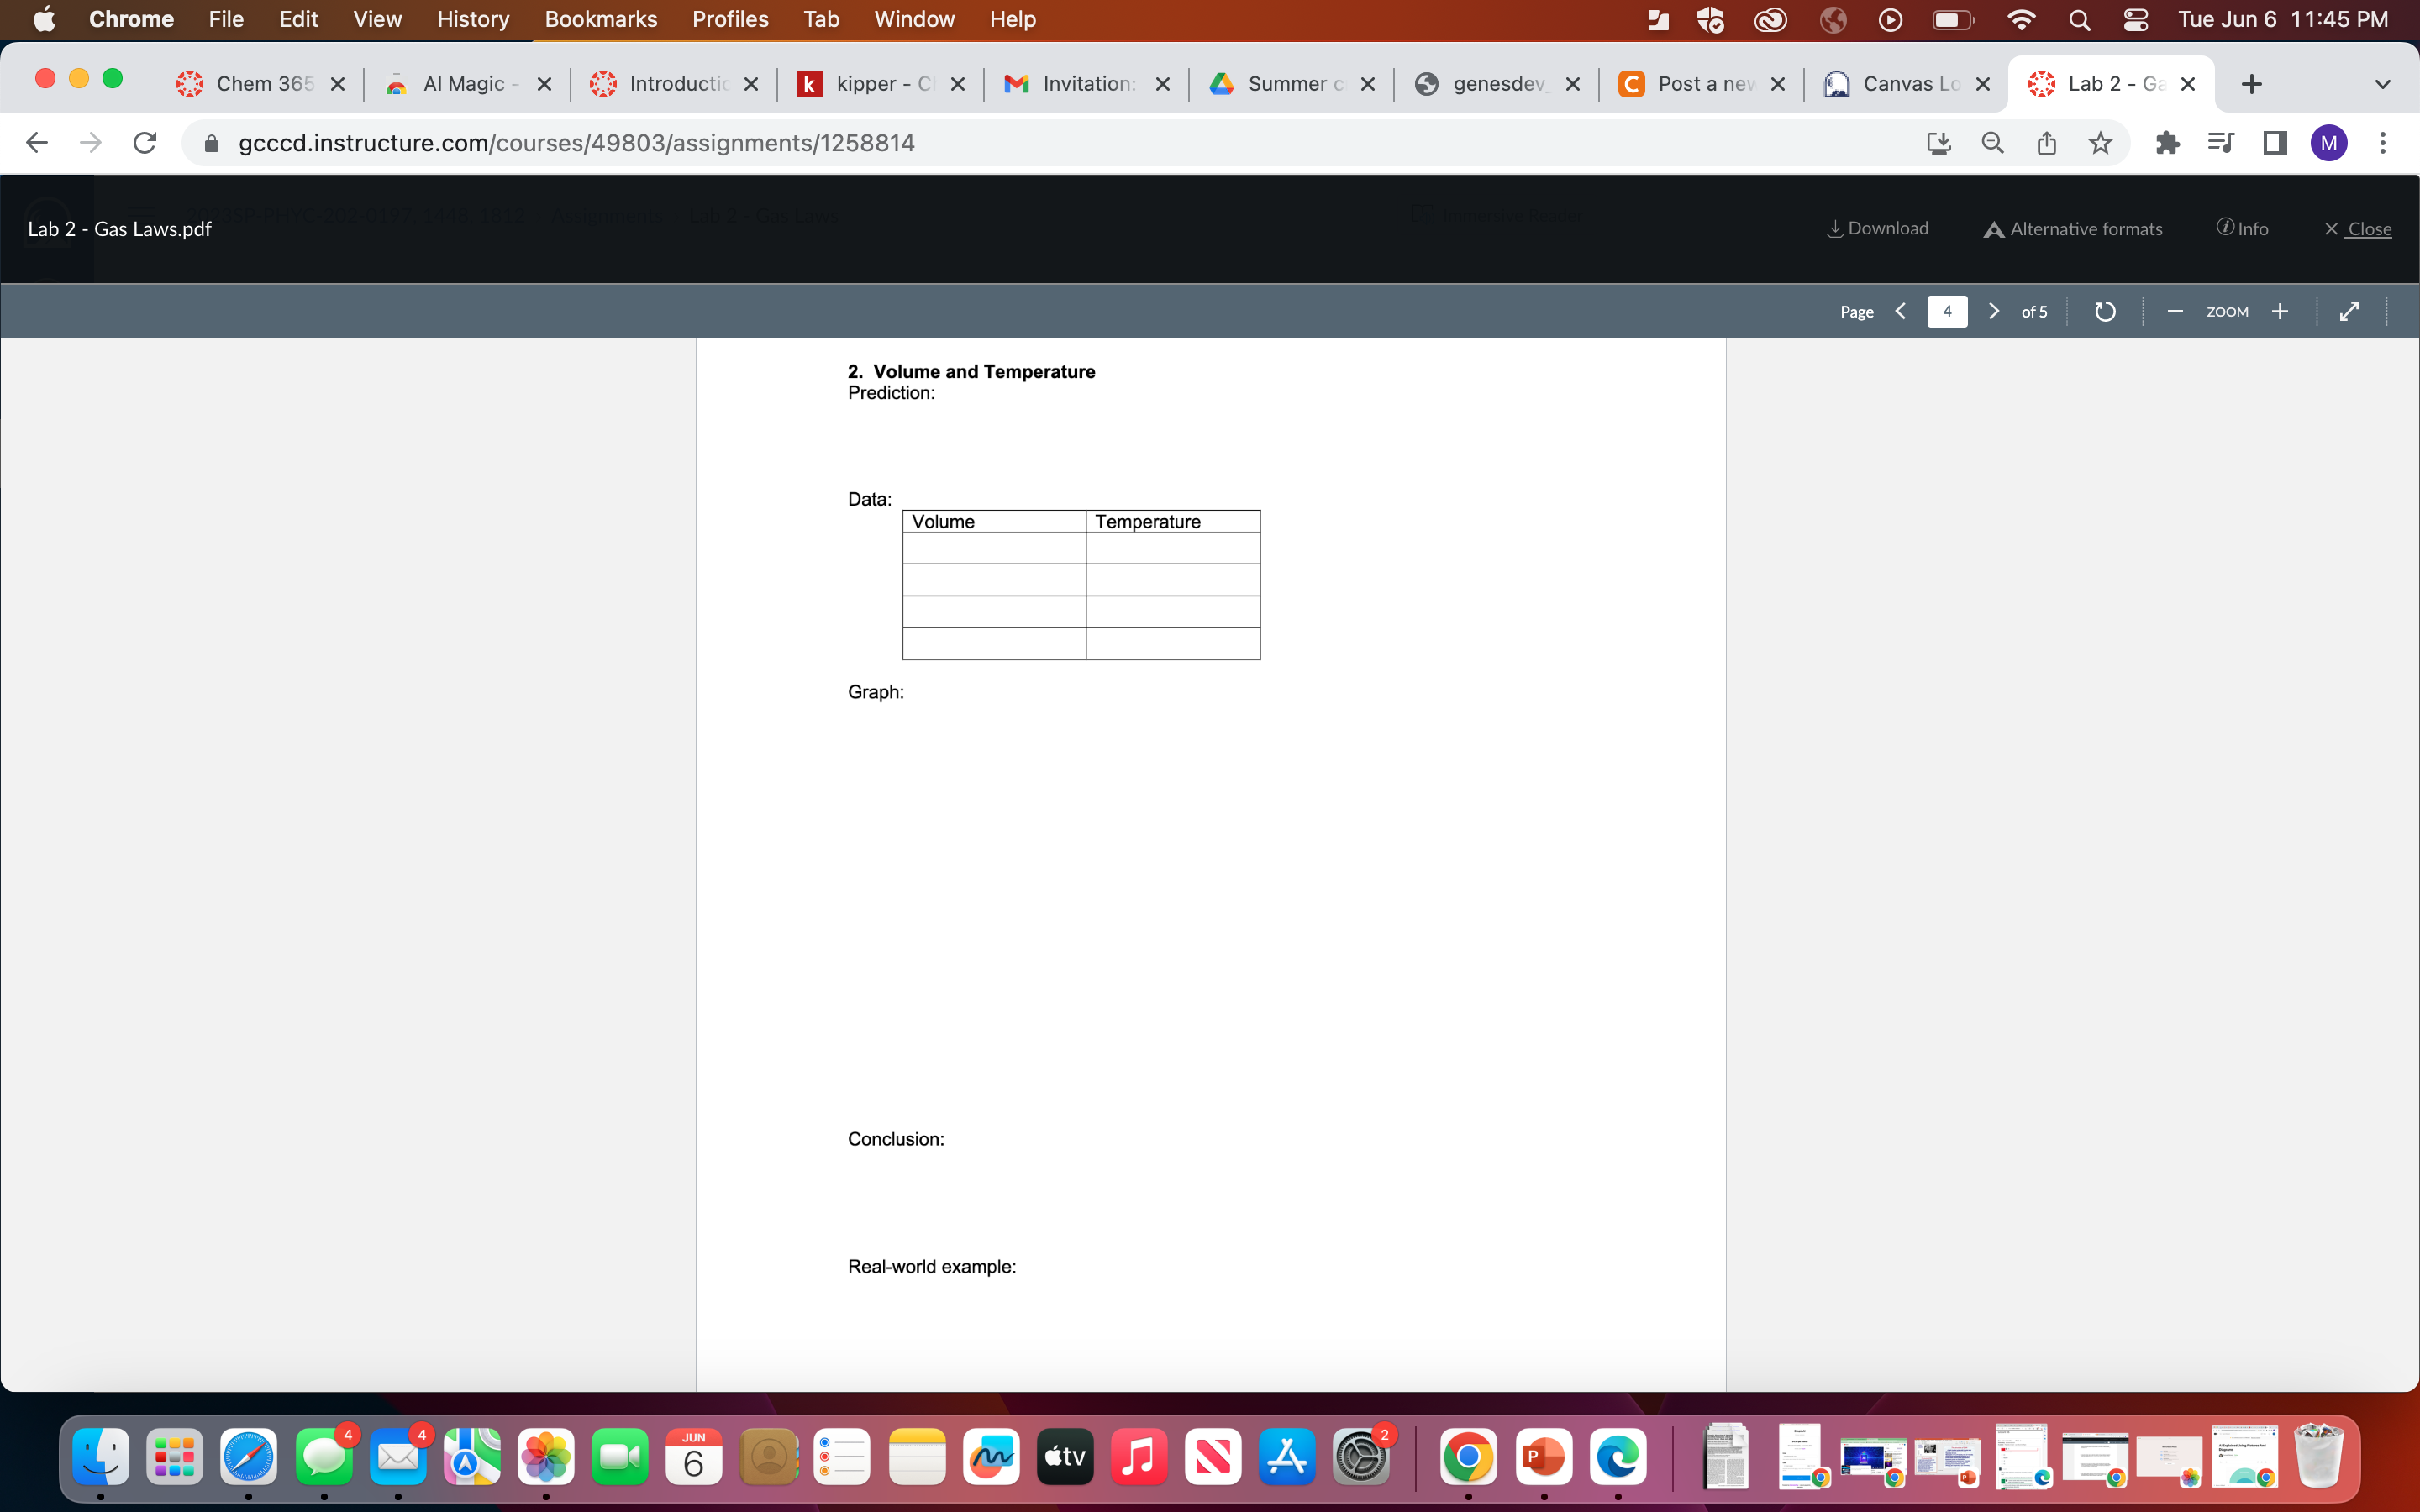
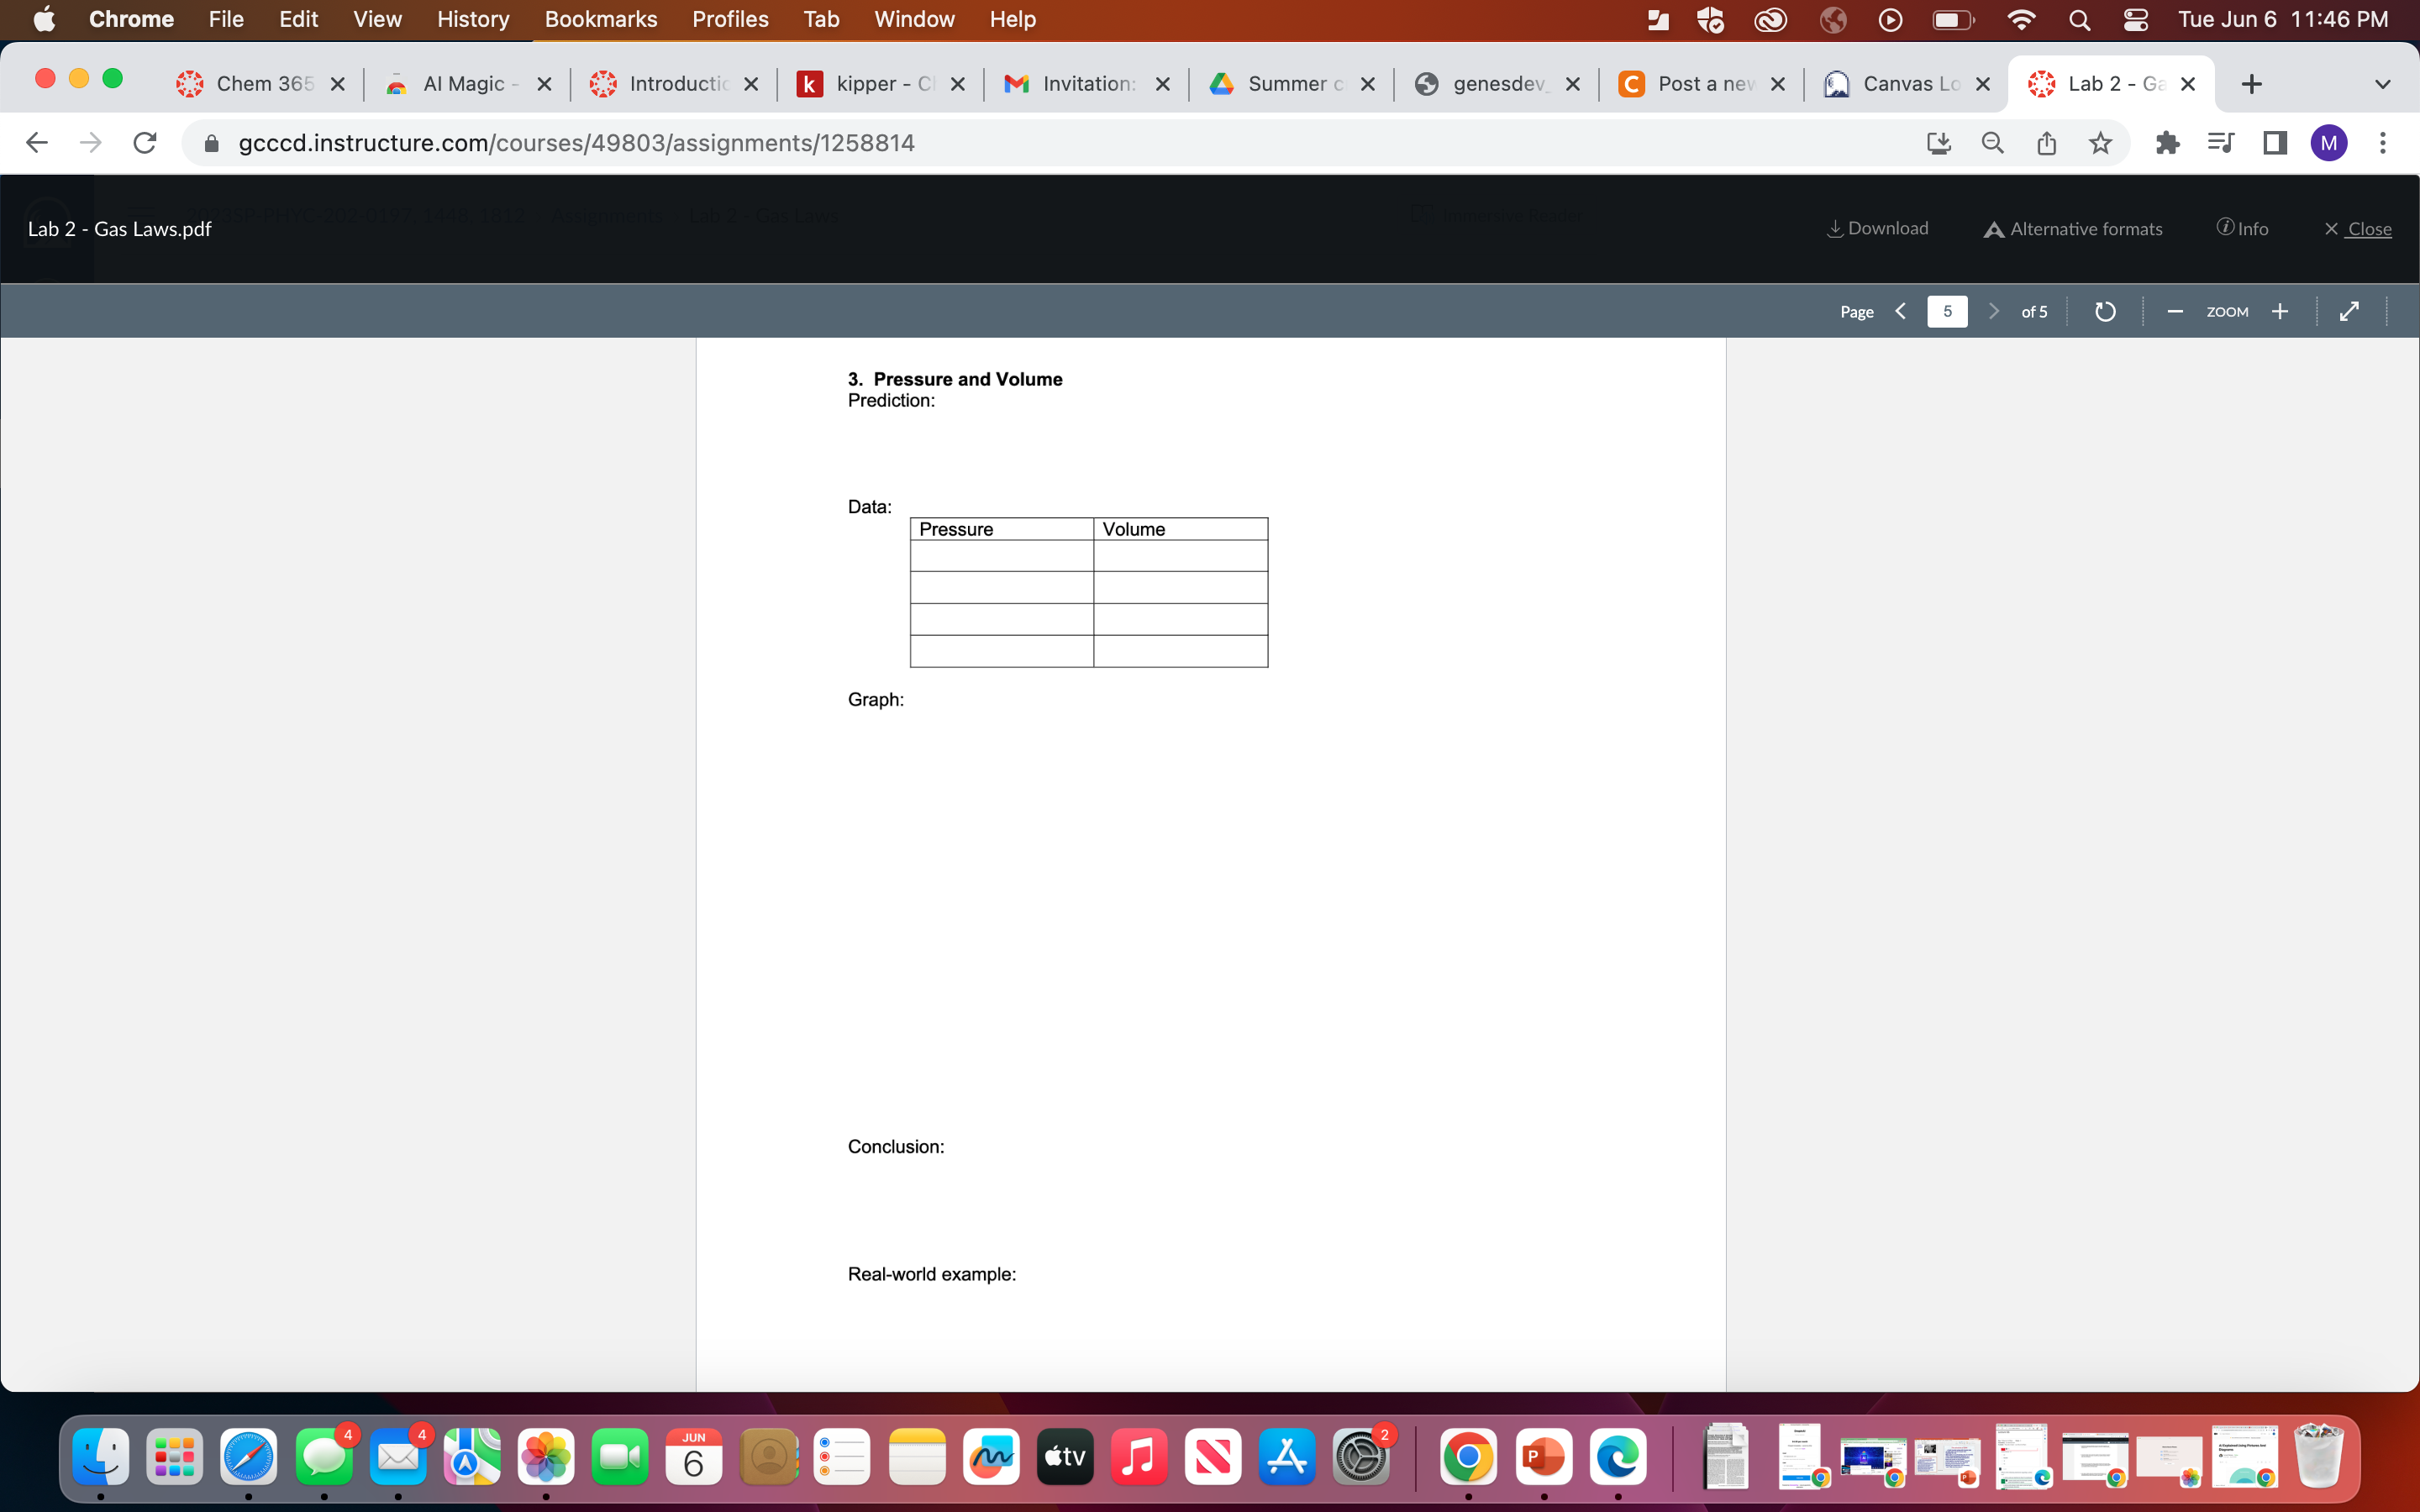
 II. Gas Law Graphing In this section we will vary temperature or volume on this simulation and use the measurement tools to record 4 data points for each gas law. For each section, the unused variable needs to be set as constant (for the section on volume and temperature, set pressure as the constant variable). Then they graph data and give real-world examples. 1. Pressure and Temperature Prediction (what do you think happens to pressure as you vary temperature, what curve would this fit?): 2. Volume and Temperature Prediction: 3. Pressure and Volume Prediction: De Graph
 Step by Step Solution
There are 3 Steps involved in it
Step: 1

Get Instant Access to Expert-Tailored Solutions
See step-by-step solutions with expert insights and AI powered tools for academic success
Step: 2

Step: 3

Ace Your Homework with AI
Get the answers you need in no time with our AI-driven, step-by-step assistance
Get Started


