

Answered step by step
Verified Expert Solution
Question
1 Approved Answer
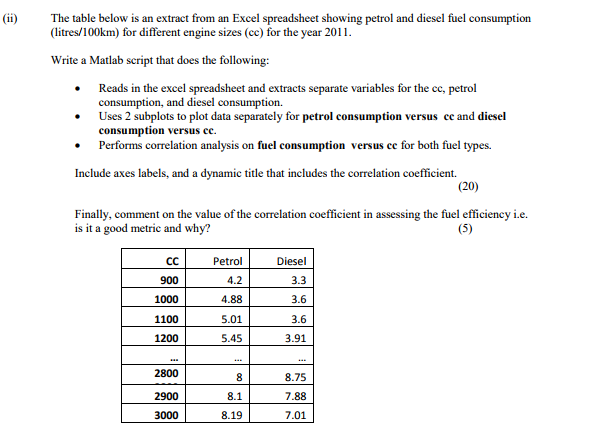
(ii The table below is an extract from an Excel spreadsheet showing petrol and diesel fuel consumption (litres/100km) for different engine sizes (cc) for the
Step by Step Solution
There are 3 Steps involved in it
Step: 1

Get Instant Access to Expert-Tailored Solutions
See step-by-step solutions with expert insights and AI powered tools for academic success
Step: 2

Step: 3
Ace Your Homework with AI
Get the answers you need in no time with our AI-driven, step-by-step assistance
Get Started
Mastering Sports Analytics With R Insights From Soccer Nba Nfl Baseball Hockey Tennis Golf And Boxing
Authors: Lauren Gallardo
1st Edition
B0CHGB9X8T, 979-8860571174