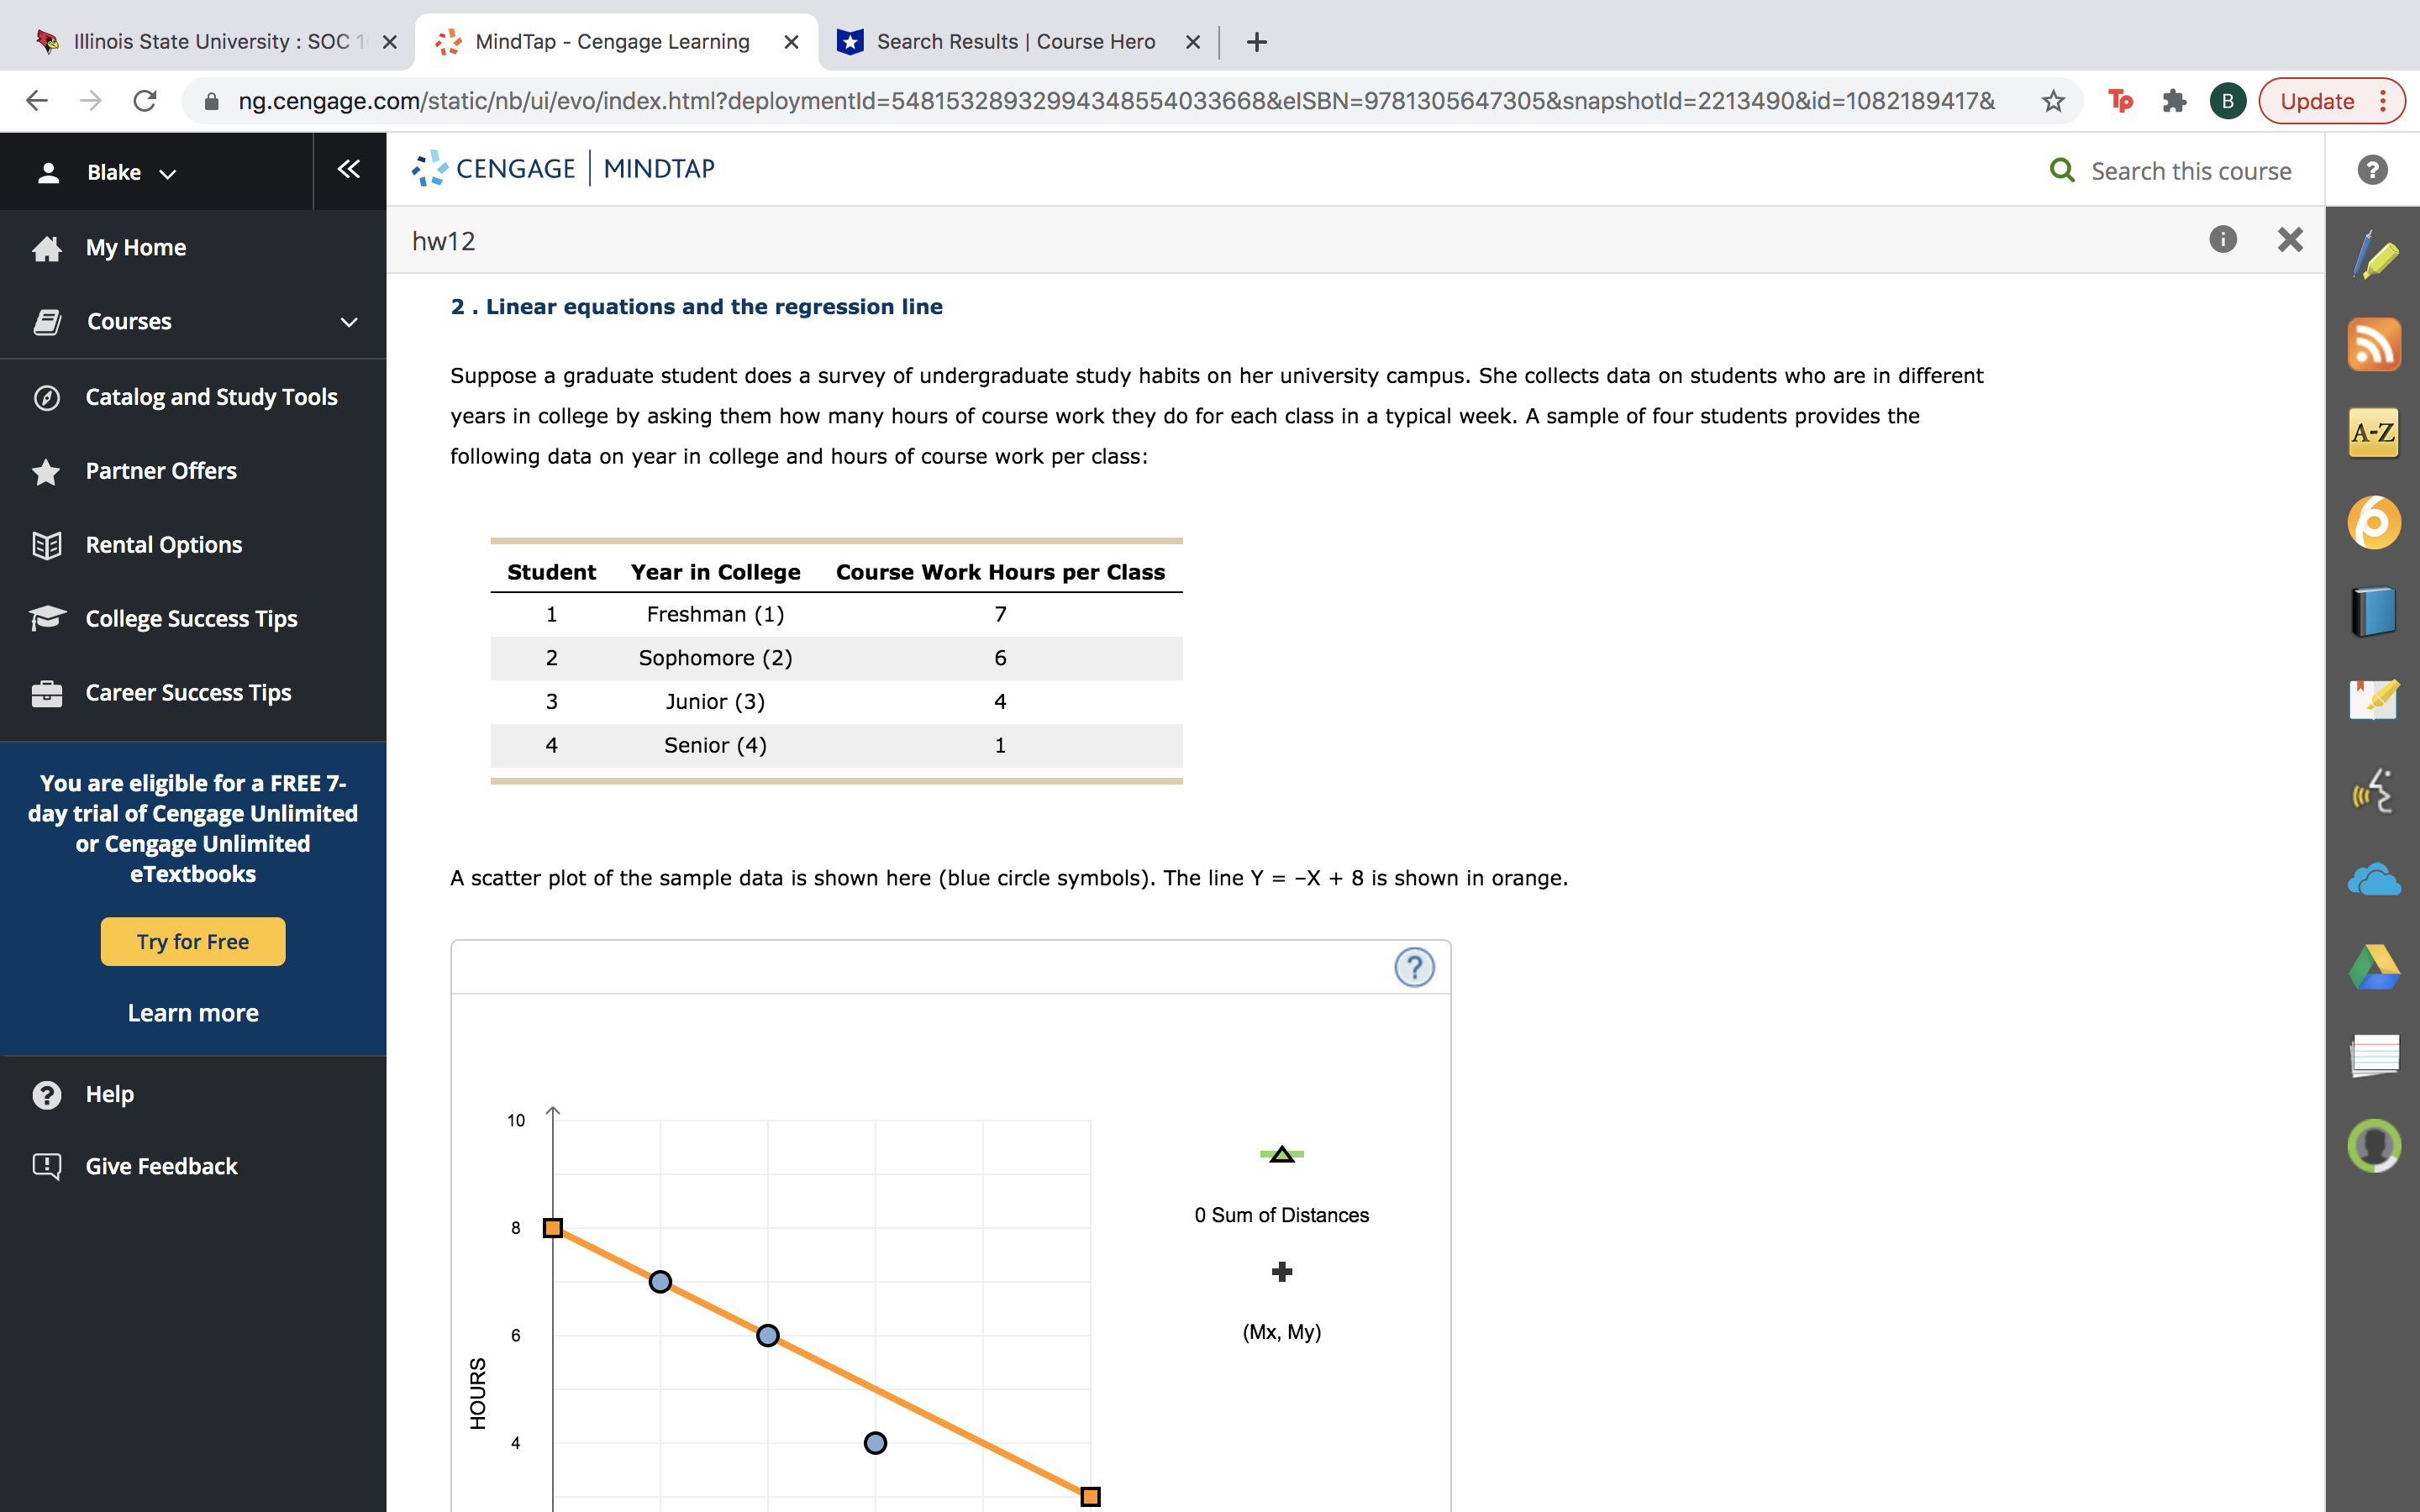
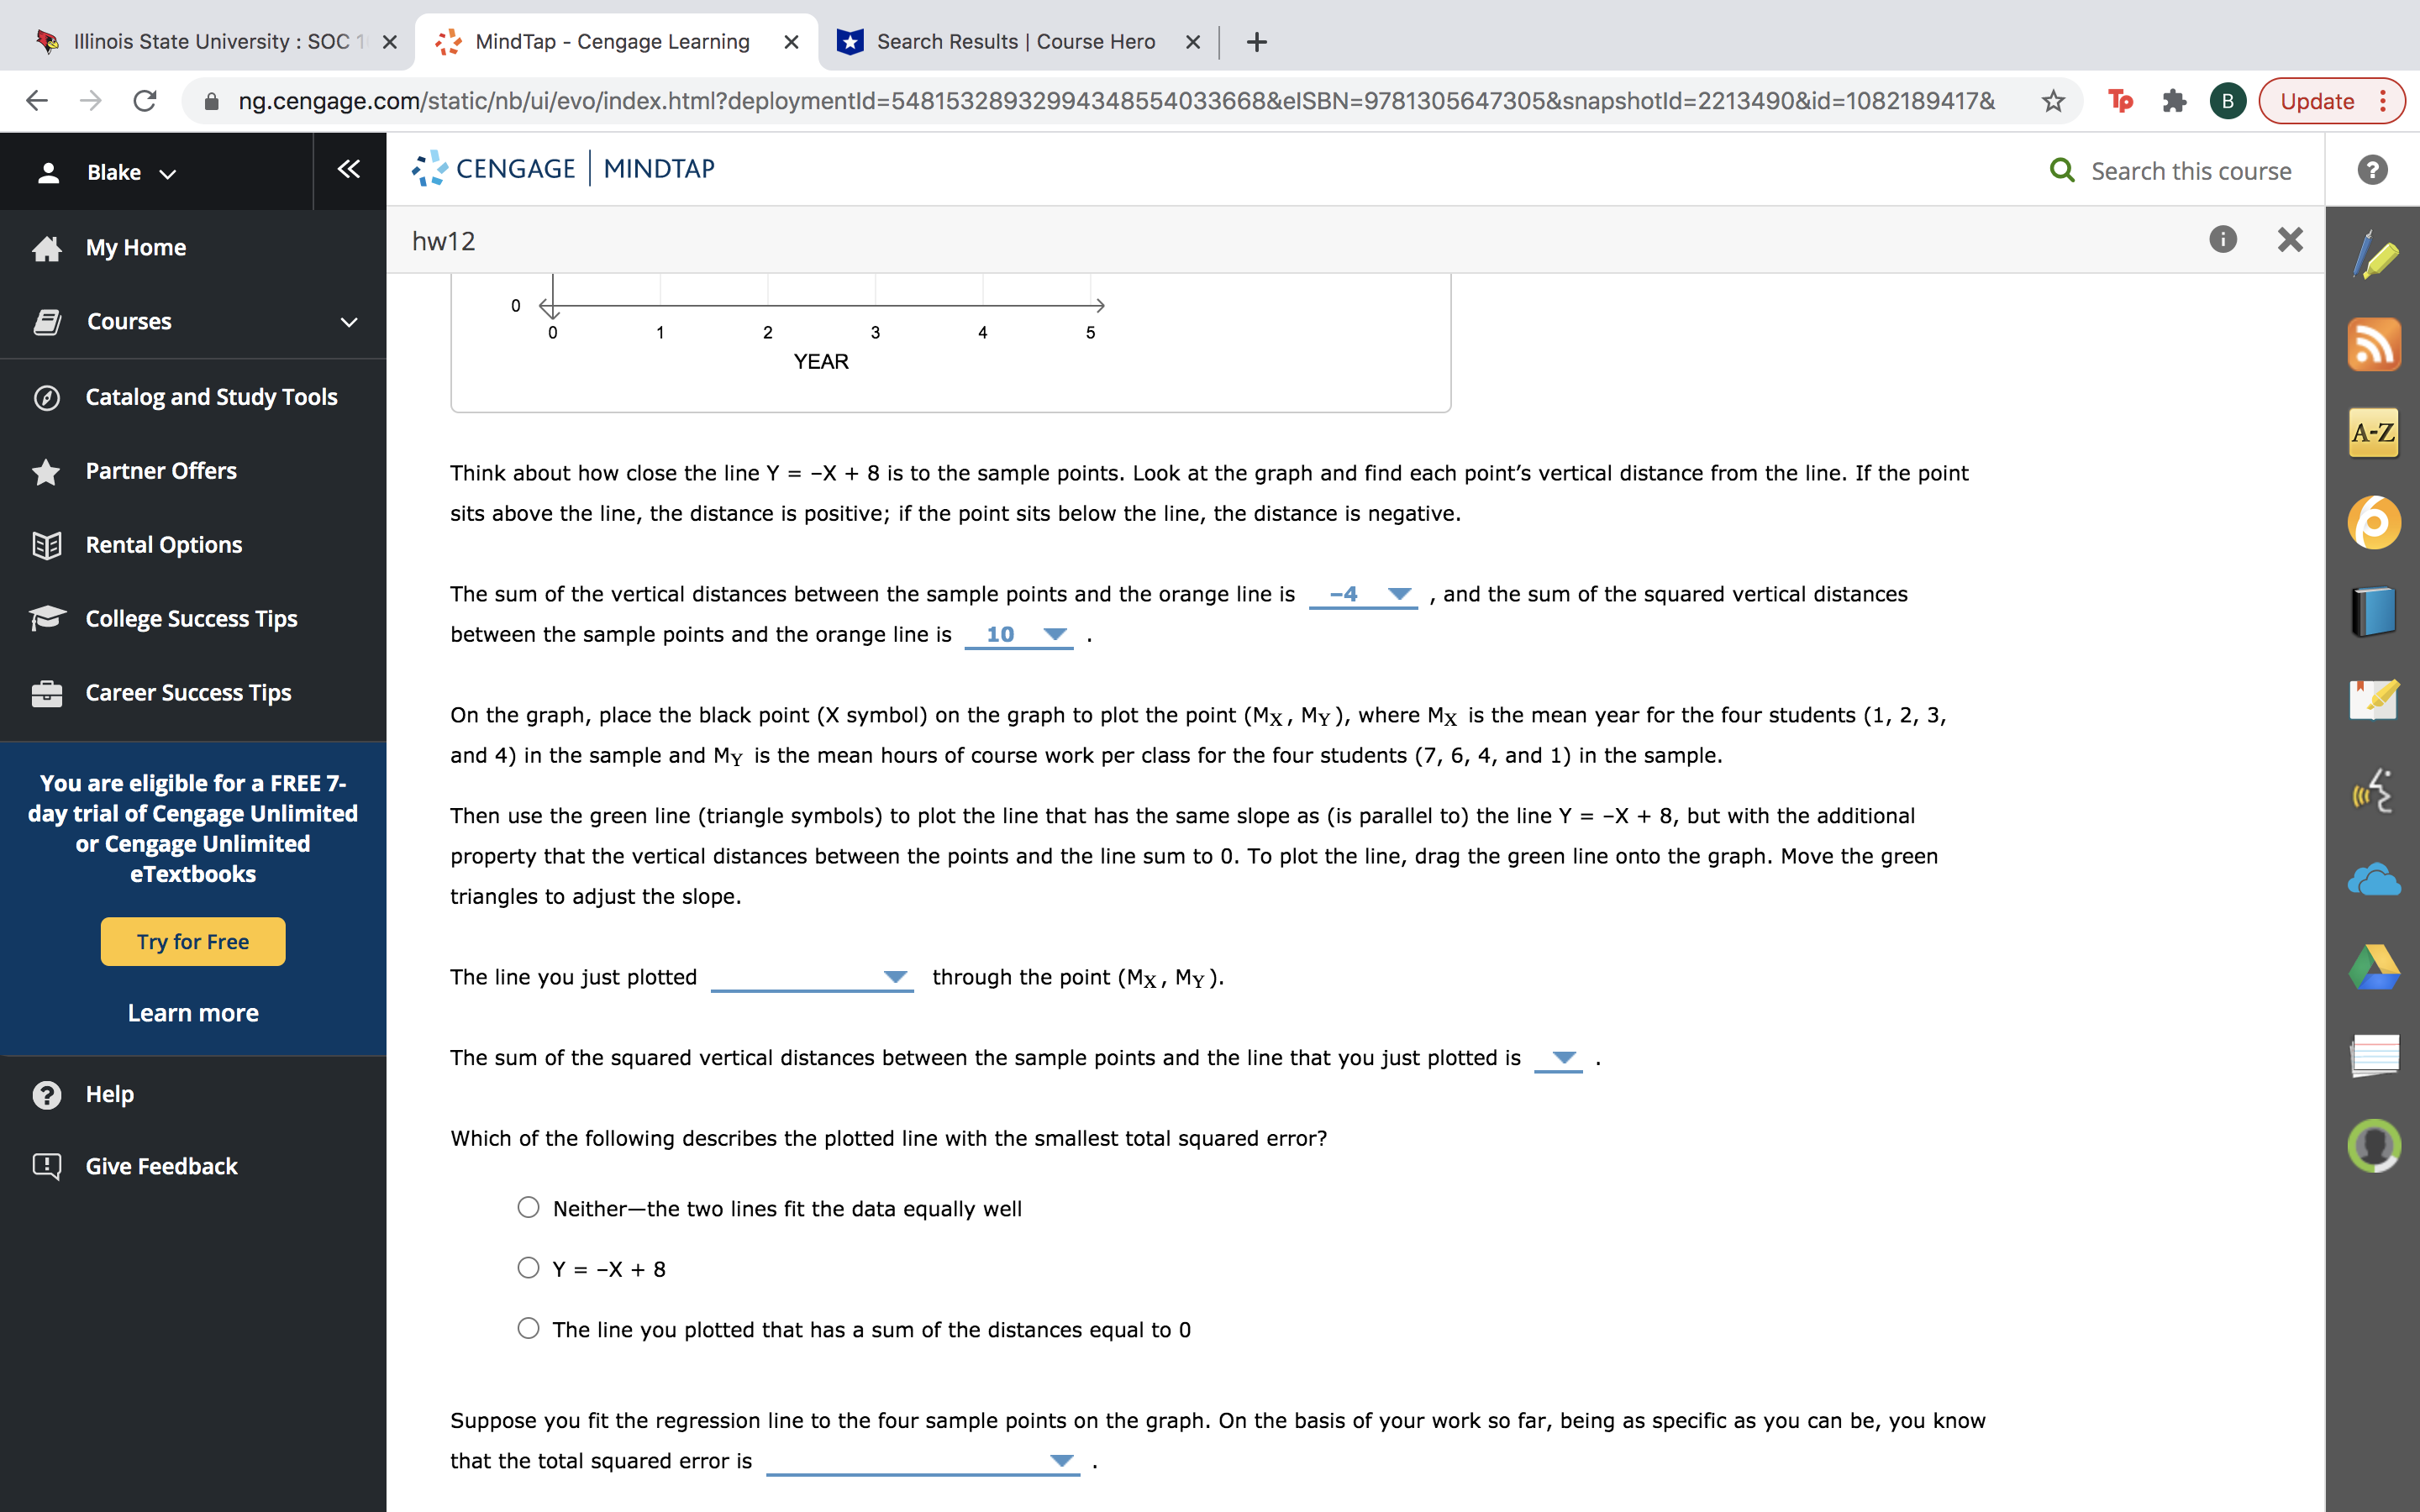
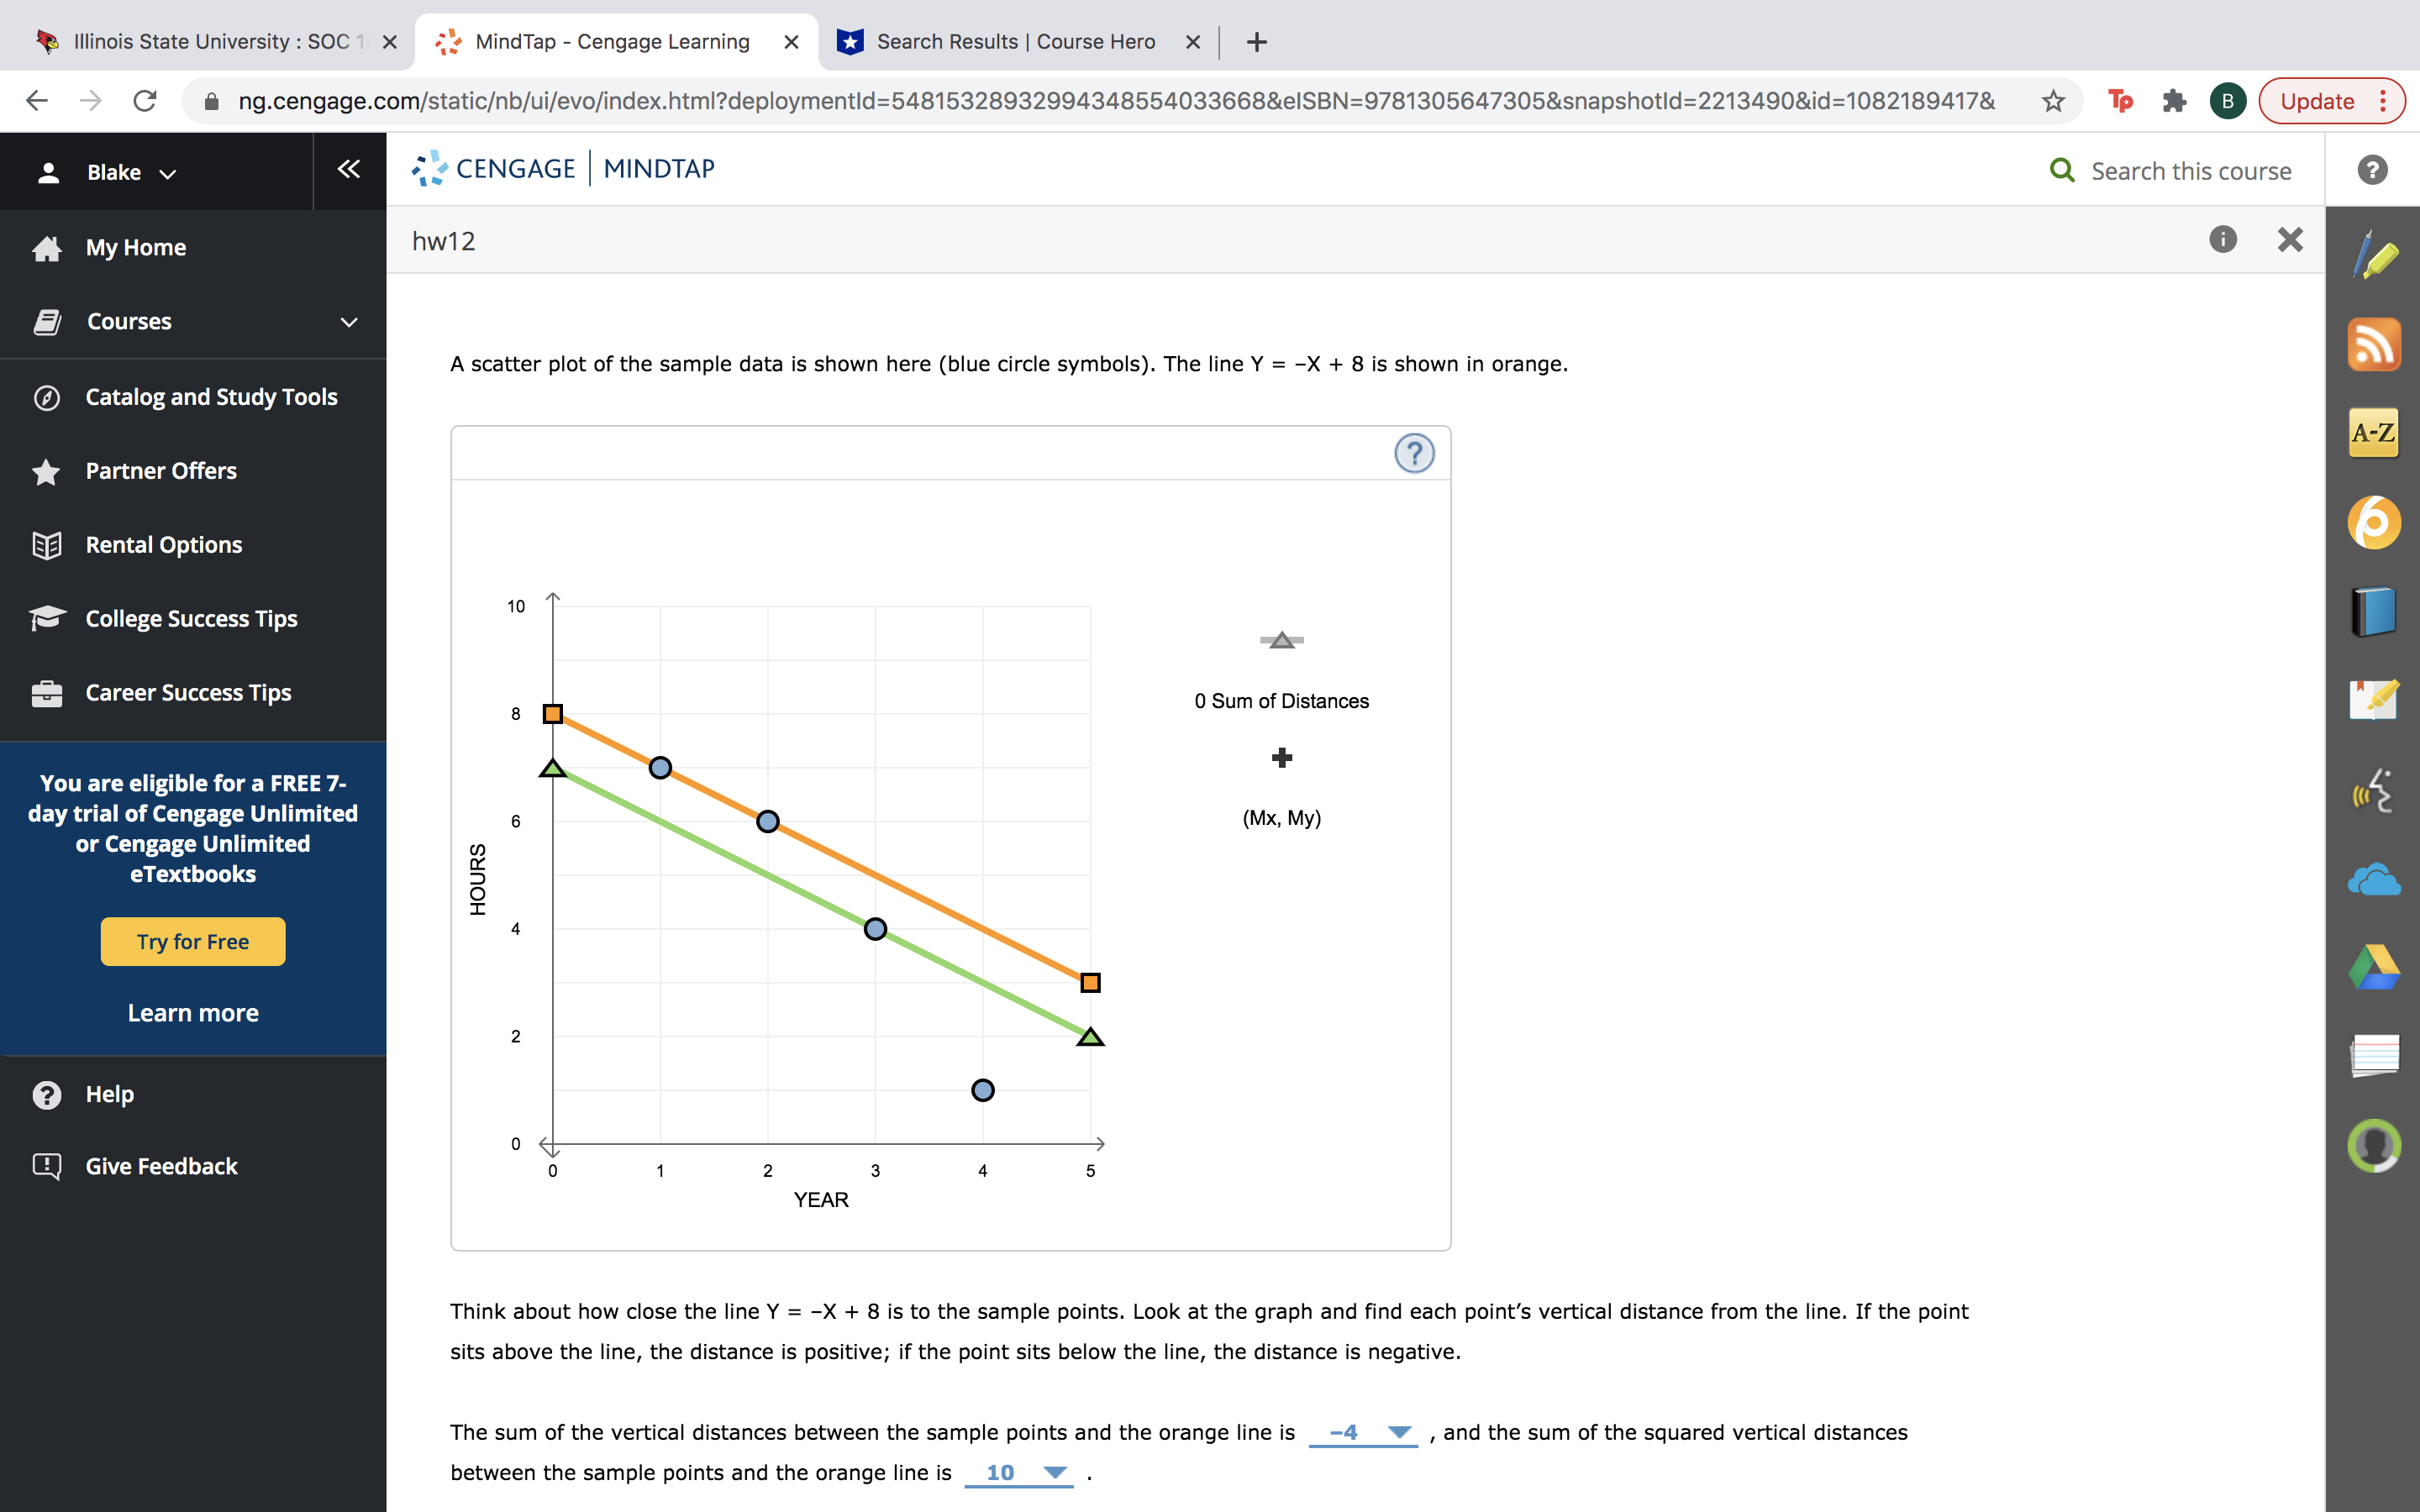
Illinois State University : SOC 1 x MindTap - Cengage Learning * *Search Results | Course Hero X + C ng.cengage.com/staticb/ui/evo/index.html?deploymentld=54815328932994348554033668&elSBN=9781305647305&snapshotld=2213490&id=1082189417& TP # B Update : . Blake CENGAGE | MINDTAP Q Search this course ? My Home hw 12 X Courses 2 . Linear equations and the regression line Suppose a graduate student does a survey of undergraduate study habits on her university campus. She collects data on students who are in different Catalog and Study Tools years in college by asking them how many hours of course work they do for each class in a typical week. A sample of four students provides the A-Z Partner Offers following data on year in college and hours of course work per class: Rental Options Student Year in College Course Work Hours per Class College Success Tips Freshman (1) 7 N Sophomore (2) A O Career Success Tips w Junior (3) 4 Senior (4) You are eligible for a FREE 7- day trial of Cengage Unlimited or Cengage Unlimited eTextbooks A scatter plot of the sample data is shown here (blue circle symbols). The line Y = -X + 8 is shown in orange. Try for Free ? Learn more ? Help 10 Give Feedback 0 Sum of Distances 8 O 6 O (Mx, My) HOURS 4 O Illinois State University:SOCi X of: MindTap-Cengage Learning X H Search Resultleourse Hero X I + ( > C i ng.cengage.com/staticb/ui/evo/index.htm|?deploymentld=54815328932994348554033668&eISBN=978'I305647305&snapshotld=2213490&id=10821894'l7& Blake v oz: CENGAGE I MINDTAP My Home hW12 o J, > Courses 0 1 2 3 4 5 YEAR Catalog and Study Tools Partner Offers Think about how close the line Y = X + 8 is to the sample points. Look at the graph and nd each point's vertical distance from the line. If the point sits above the line, the distance is positive; if the point sits below the line, the distance is negative. Rental Options The sum of the vertical distances between the sample points and the orange line is 4 V , and the sum of the squared vertical distances C II S T' ' 0 age uccess 'ps between the sample points and the orange line is 10 V . Career Success Tips On the graph, place the black point (X symbol) on the graph to plot the point (Mx, My ), where Mx is the mean year for the four students (1, 2, 3, and 4) in the sample and My is the mean hours of course work per class for the four students (7, 6, 4, and 1) in the sample. You are eligible for a FREE 7- day trial of Cengage Unlimited Then use the green line (triangle symbols) to plot the line that has the same slope as (is parallel to) the line Y = X + 8, but with the additional or Cengage Unlimited eTextbooks Try for Free Learn more property that the vertical distances between the points and the line sum to 0. To plot the line, drag the green line onto the graph. Move the green triangles to adjust the slope. The line you just plotted v through the point (Mx, My). The sum of the squared vertical distances between the sample points and the line that you just plotted is V . 9 Help Which of the following describes the plotted line with the smallest total squared error? E] Give Feedback 0 Neitherthe two lines t the data equally well 0 Y = x + s O The line you plotted that has a sum of the distances equal to 0 Suppose you t the regression line to the four sample points on the graph. On the basis of your work so far, being as specic as you can be, you know that the total squared error is V . Illinois State University : SOC 1 x MindTap - Cengage Learning X *Search Results | Course Hero + C ng.cengage.com/staticb/ui/evo/index.html?deploymentld=54815328932994348554033668&elSBN=9781305647305&snapshotld=2213490&id=1082189417& TP # B Update : . Blake CENGAGE | MINDTAP Q Search this course ? My Home hw12 X Courses A scatter plot of the sample data is shown here (blue circle symbols). The line Y = -X + 8 is shown in orange. Catalog and Study Tools A-Z Partner Offers Rental Options College Success Tips 10 Career Success Tips 8 0 Sum of Distances O You are eligible for a FREE 7- A day trial of Cengage Unlimited 6 O (Mx, My) or Cengage Unlimited eTextbooks HOURS Try for Free O Learn more 2 ? Help O Give Feedback 2 3 YEAR Think about how close the line Y = -X + 8 is to the sample points. Look at the graph and find each point's vertical distance from the line. If the point sits above the line, the distance is positive; if the point sits below the line, the distance is negative. The sum of the vertical distances between the sample points and the orange line is -4 , and the sum of the squared vertical distances between the sample points and the orange line is 10