

Answered step by step
Verified Expert Solution
Question
1 Approved Answer
ILUMINUMA S OUDFROZB9D654834BBC454A7FCCA4F7E01 16 Accounts Payable (Days) 19 Capital Expenditures ($000's) 20 Deblesuance (Repayment (5000) 21 Equity bowed (Repaid (5000s) 15.000 15,000 50% 30% 3/
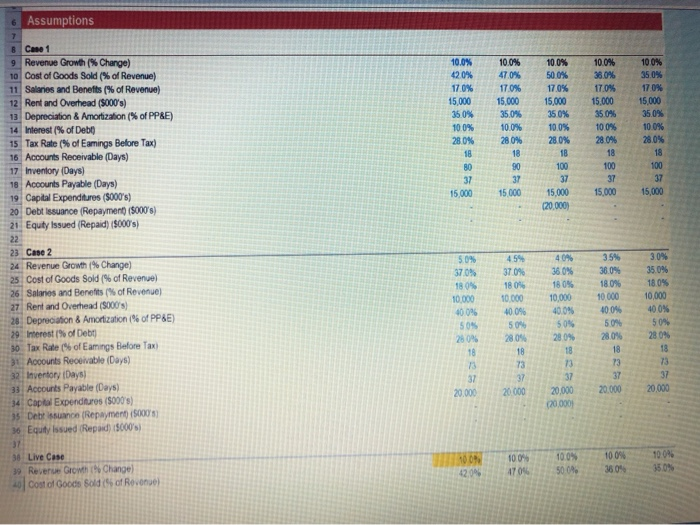
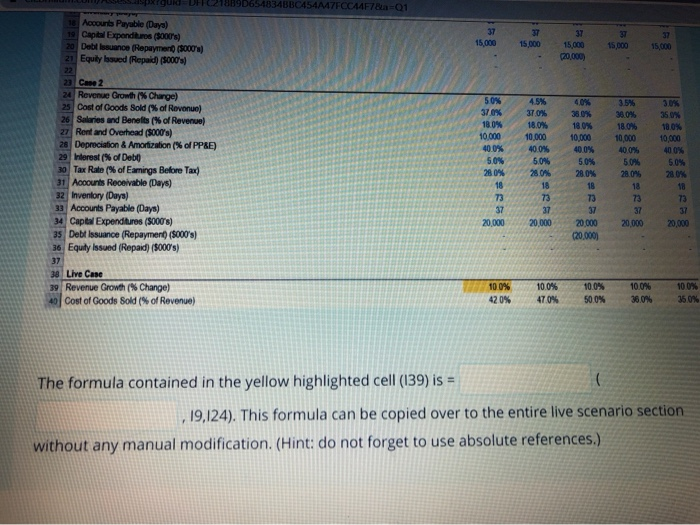
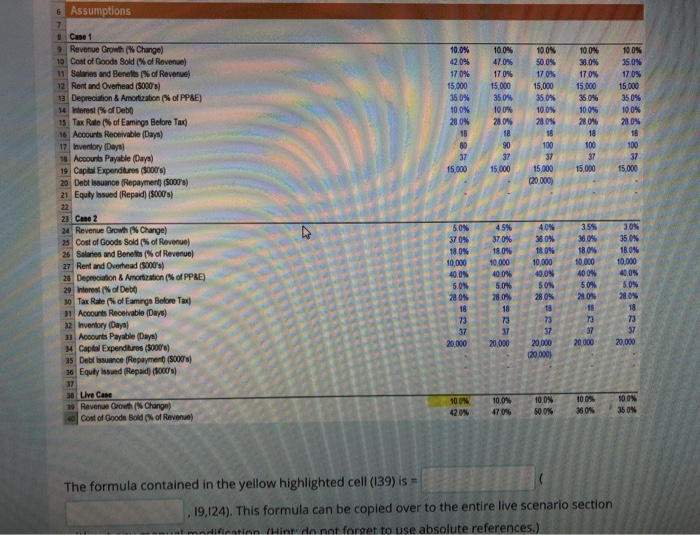 ILUMINUMA S OUDFROZB9D654834BBC454A7FCCA4F7E01 16 Accounts Payable (Days) 19 Capital Expenditures ($000's) 20 Deblesuance (Repayment (5000) 21 Equity bowed (Repaid (5000s) 15.000 15,000 50% 30% 3/ 0% 37.00 100% 10.000 40.0% 23 Case 2 24 Revenue Growth Charge) 25 Cost of Goods Sold (% of Revenue) 26 Salaries and Benefits (% of Revenue) 27 Rent and Overhead (S000's) 28 Depreciation & Amortization (% of PP&E) 29 Interest (% of Debt 30 Tax Rate(% of Earings Before Tax) 31 Accounts Receivable (Days) 32 Inventory (Days) 33 Accounts Payable (Days) 34 Capital Expenditures (5000's) 35 Debt Issuance (Repayment ($000's) 36 Equity Issued (Repaid) (5000's) 10,000 40.0% 5.0% 280% 40% 3803 18.00 10.000 40.0% 50% 28.0% 18 3.5% 38095 1806 10.000 40.092 50 28.04 18.02 10,000 400% 50 50% 28.046 28.0% 18 73 20.000 20 000 20.000 20,000 20.000 (20.000) 38 Live Case 39 Revenue Growth Change) 40 Cost of Goods Sold (% of Revenue) 10.0% 42 0% 100% 47.0% 100% 50.0% 100% 36,0% 100% 350% The formula contained in the yellow highlighted cell (139) is = 1,19,124). This formula can be copied over to the entire live scenario section without any manual modification. (Hint: do not forget to use absolute references.) 6 Assumptions 170 8 Case 1 9 Revenue Growth ( Change) 10 Cost of Goods Sold ( of Revenue) 11 Salaries and Benefits of Revenue) 12 Rent and Overhead (5000's) 13 Depreciation & Amortization of PP&E) 14 Interest of Debo 15 Tax Rate(% of Earings Before Tax) 16 Accounts Receivable (Days) 17 Inventory (Days) 18 Accounts Payable (Days) 19 Capital Expenditures (3000's) 20 Debt Issuance (Repayment (S000's) 21 Equity Issued (Repaid) (5000's) 42.09 17.0% 15,000 35.0 10.0% 28.0% 10.096 100% 100% 100% 47095 50 0% 33.096 1709 170% 17 0% 15,000 15.000 15 000 15.000 35.0% 35.0% 350% 35.0% 10.0% 100% 100% 28.0% 28.0% 28 0% 28.0% 18181818 100 100 37 37 15,000 15,000 15,000 15.000 1004 15,000 20.000) - 23 Case 2 24 Revenue Growth Change) 25 Cost of Goods Sold (% of Revenue) 26 Salaries and Benefits of Revenue) 27 Rent and Overhead (8000's) 28 Depreciation & Amortization of PPLE) 29 Interest of Debt 30 Tax Rate(% of Eamings Before Taxi) 31 Accounts Receivable (Days) 32 Inventory (Days) 33 Accounts Payable (Days) 4 Capital Expenditures (5000) 35 Debt Issuance (Repayment (8000) 36 Equy Insued (Repaid) (8000) 50% 45% 40% 35% 30% 37.0% 37 0% 380 36 0 35045 18 0% 1805 18 0% 10% 100% 10.000 10000 10.000 10.000 10.000 40.0% 40.046 4 0.0% 400% 400% 50% 5.0% 50% 50% 5.0% 28 0% 28.0% 28 ON 2 0.0% 28.0% 181818 1818 737373 73 373737 20.000 20000 20000 20.000 (20,000) 38 Live Case Revenue Growth / Change 40 Cost of Goods Bold of Revenue) 100% 47.0% 100% 50.05 100% 5 0% 100% 350% 3 The formula contained in the yellow highlighted cell (139) is = ,19,124). This formula can be copied over to the entire live scenario section - modification (Hint: do not forget to use absolute references.) ILUMINUMA S OUDFROZB9D654834BBC454A7FCCA4F7E01 16 Accounts Payable (Days) 19 Capital Expenditures ($000's) 20 Deblesuance (Repayment (5000) 21 Equity bowed (Repaid (5000s) 15.000 15,000 50% 30% 3/ 0% 37.00 100% 10.000 40.0% 23 Case 2 24 Revenue Growth Charge) 25 Cost of Goods Sold (% of Revenue) 26 Salaries and Benefits (% of Revenue) 27 Rent and Overhead (S000's) 28 Depreciation & Amortization (% of PP&E) 29 Interest (% of Debt 30 Tax Rate(% of Earings Before Tax) 31 Accounts Receivable (Days) 32 Inventory (Days) 33 Accounts Payable (Days) 34 Capital Expenditures (5000's) 35 Debt Issuance (Repayment ($000's) 36 Equity Issued (Repaid) (5000's) 10,000 40.0% 5.0% 280% 40% 3803 18.00 10.000 40.0% 50% 28.0% 18 3.5% 38095 1806 10.000 40.092 50 28.04 18.02 10,000 400% 50 50% 28.046 28.0% 18 73 20.000 20 000 20.000 20,000 20.000 (20.000) 38 Live Case 39 Revenue Growth Change) 40 Cost of Goods Sold (% of Revenue) 10.0% 42 0% 100% 47.0% 100% 50.0% 100% 36,0% 100% 350% The formula contained in the yellow highlighted cell (139) is = 1,19,124). This formula can be copied over to the entire live scenario section without any manual modification. (Hint: do not forget to use absolute references.) 6 Assumptions 170 8 Case 1 9 Revenue Growth ( Change) 10 Cost of Goods Sold ( of Revenue) 11 Salaries and Benefits of Revenue) 12 Rent and Overhead (5000's) 13 Depreciation & Amortization of PP&E) 14 Interest of Debo 15 Tax Rate(% of Earings Before Tax) 16 Accounts Receivable (Days) 17 Inventory (Days) 18 Accounts Payable (Days) 19 Capital Expenditures (3000's) 20 Debt Issuance (Repayment (S000's) 21 Equity Issued (Repaid) (5000's) 42.09 17.0% 15,000 35.0 10.0% 28.0% 10.096 100% 100% 100% 47095 50 0% 33.096 1709 170% 17 0% 15,000 15.000 15 000 15.000 35.0% 35.0% 350% 35.0% 10.0% 100% 100% 28.0% 28.0% 28 0% 28.0% 18181818 100 100 37 37 15,000 15,000 15,000 15.000 1004 15,000 20.000) - 23 Case 2 24 Revenue Growth Change) 25 Cost of Goods Sold (% of Revenue) 26 Salaries and Benefits of Revenue) 27 Rent and Overhead (8000's) 28 Depreciation & Amortization of PPLE) 29 Interest of Debt 30 Tax Rate(% of Eamings Before Taxi) 31 Accounts Receivable (Days) 32 Inventory (Days) 33 Accounts Payable (Days) 4 Capital Expenditures (5000) 35 Debt Issuance (Repayment (8000) 36 Equy Insued (Repaid) (8000) 50% 45% 40% 35% 30% 37.0% 37 0% 380 36 0 35045 18 0% 1805 18 0% 10% 100% 10.000 10000 10.000 10.000 10.000 40.0% 40.046 4 0.0% 400% 400% 50% 5.0% 50% 50% 5.0% 28 0% 28.0% 28 ON 2 0.0% 28.0% 181818 1818 737373 73 373737 20.000 20000 20000 20.000 (20,000) 38 Live Case Revenue Growth / Change 40 Cost of Goods Bold of Revenue) 100% 47.0% 100% 50.05 100% 5 0% 100% 350% 3 The formula contained in the yellow highlighted cell (139) is = ,19,124). This formula can be copied over to the entire live scenario section - modification (Hint: do not forget to use absolute references.)
Step by Step Solution
There are 3 Steps involved in it
Step: 1

Get Instant Access to Expert-Tailored Solutions
See step-by-step solutions with expert insights and AI powered tools for academic success
Step: 2

Step: 3
Ace Your Homework with AI
Get the answers you need in no time with our AI-driven, step-by-step assistance
Get Started
Globalization Gating And Risk Finance
Authors: Unurjargal Nyambuu, Charles S. Tapiero
1st Edition
1119252652, 978-1119252658