

Question: I'm awful at math and do not understand the excel sheets. I think I have the right answers in the boxes, but CANVAS wont actually
I'm awful at math and do not understand the excel sheets. I think I have the right answers in the boxes, but CANVAS wont actually grade them as correct if i don't have the formula input right. Please help me understand how to do these. The screenshots are for two different excel assignments.
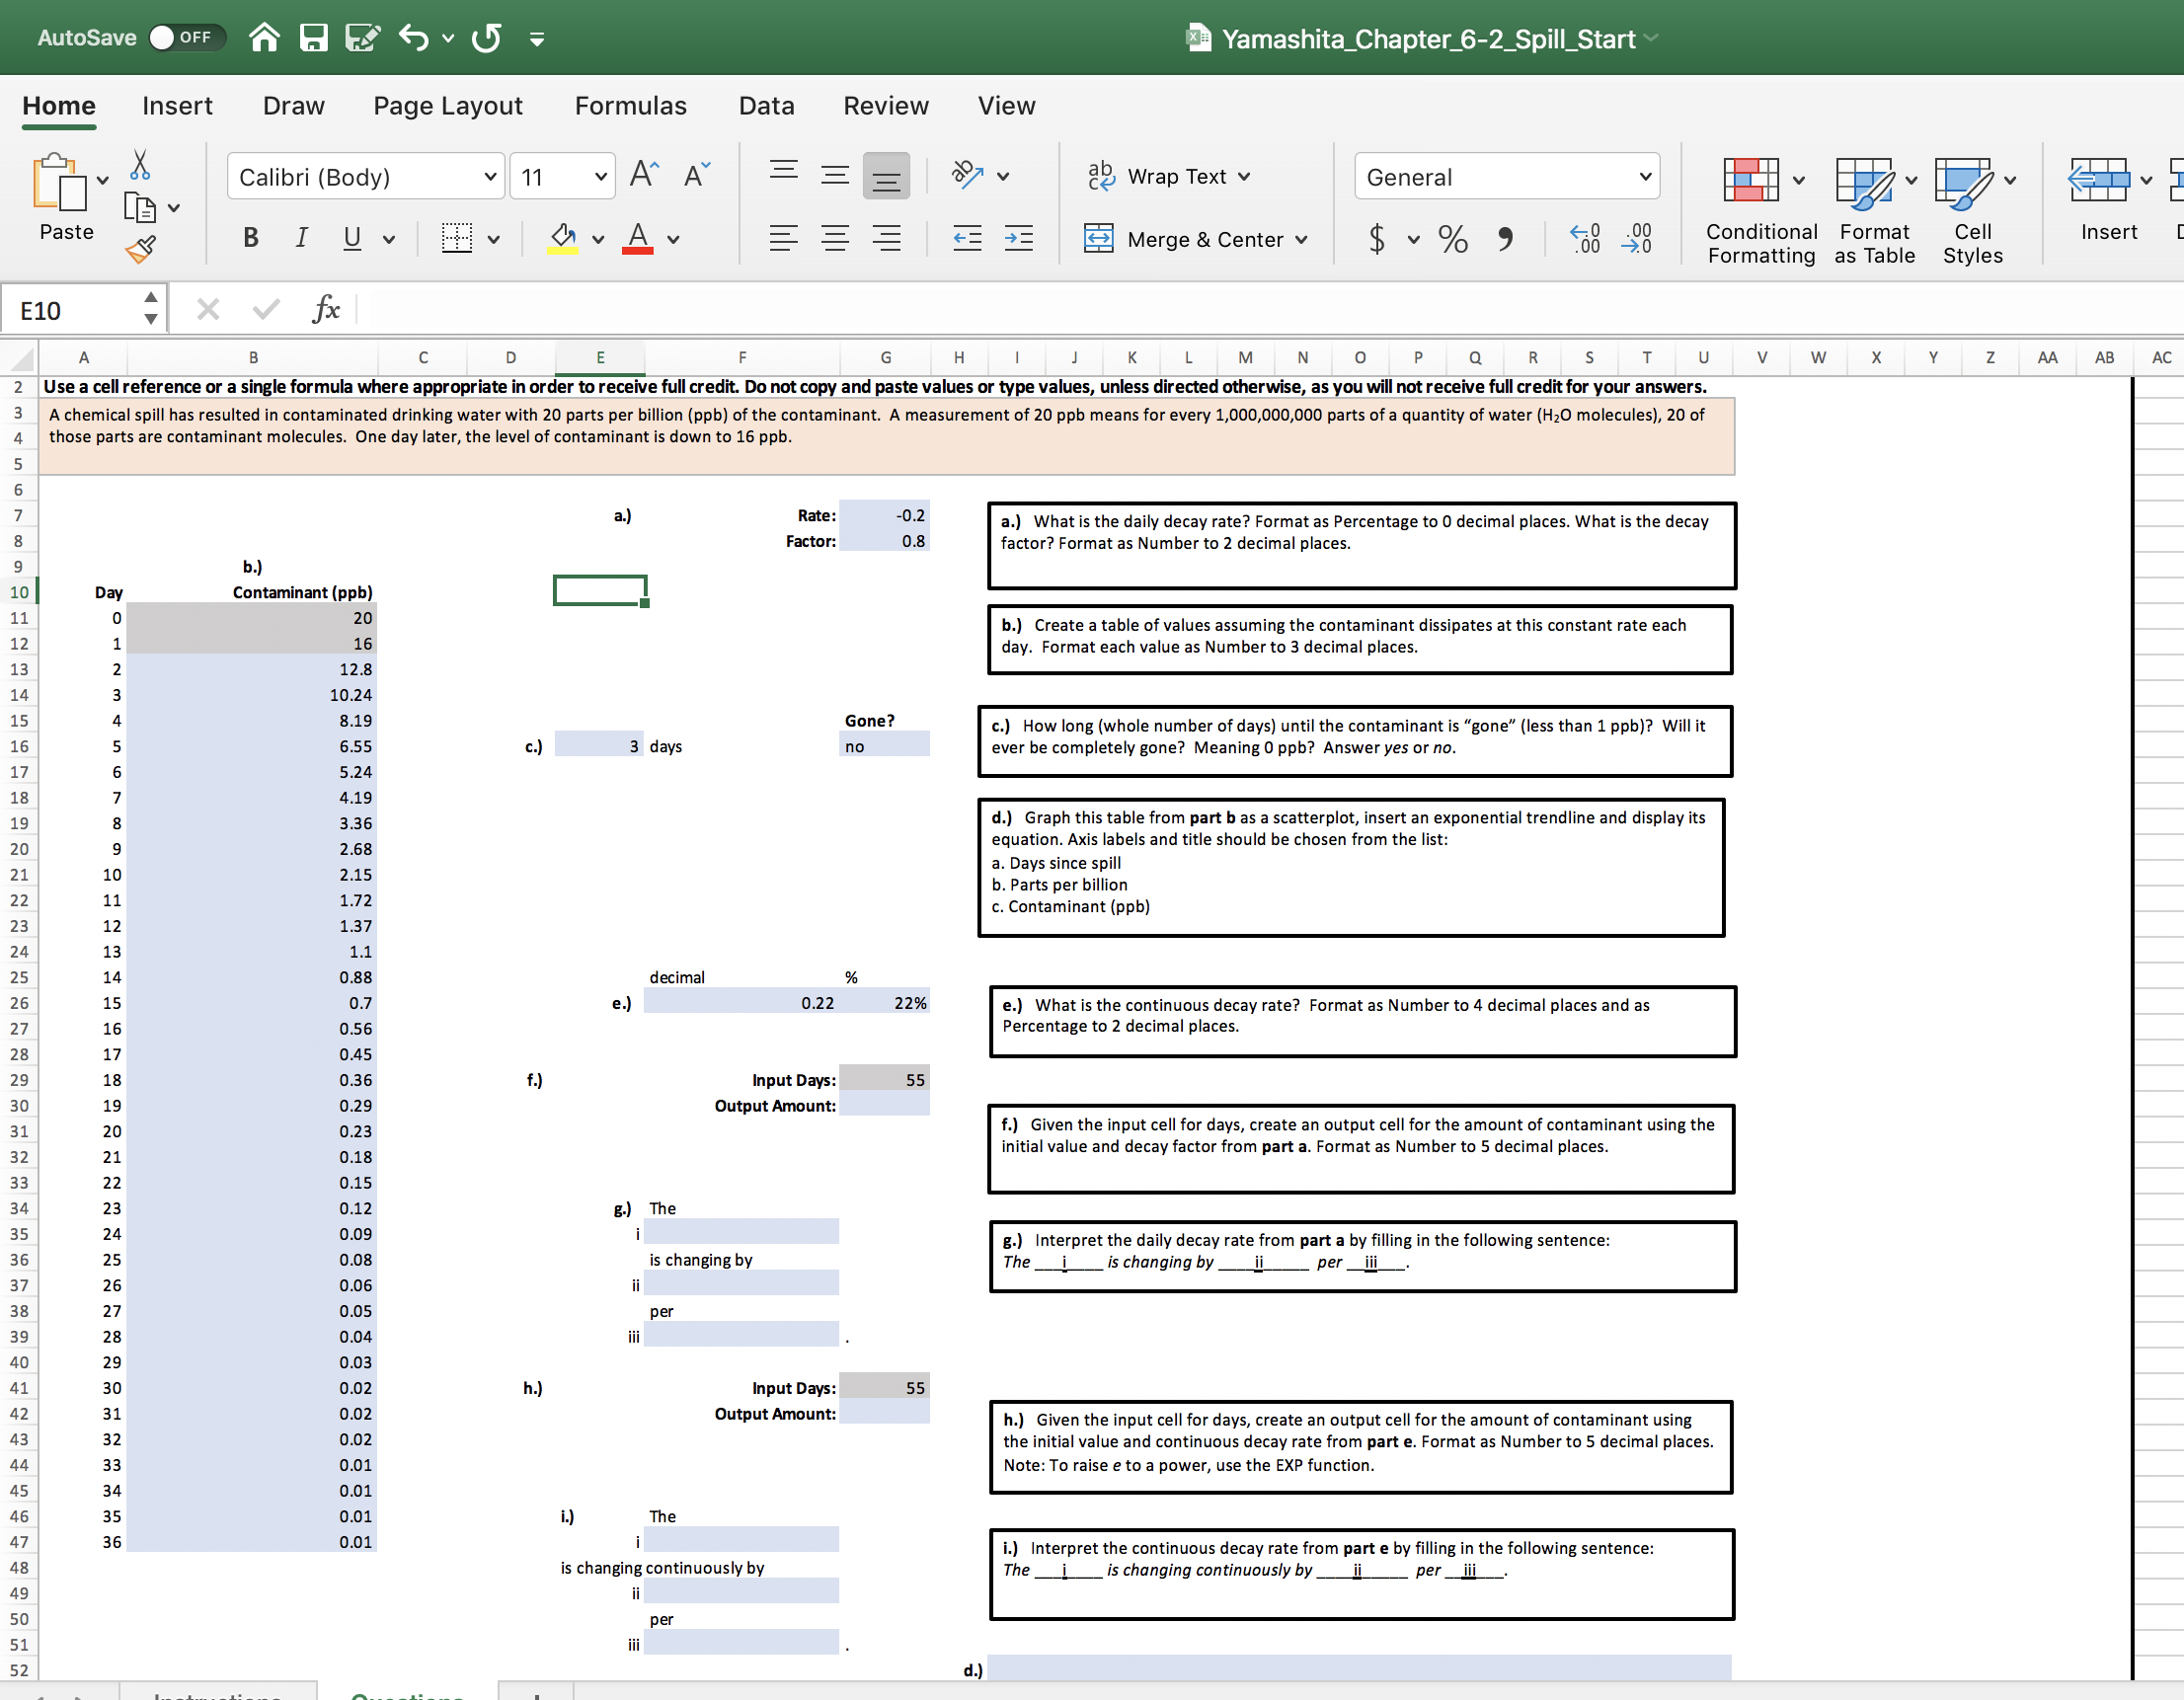
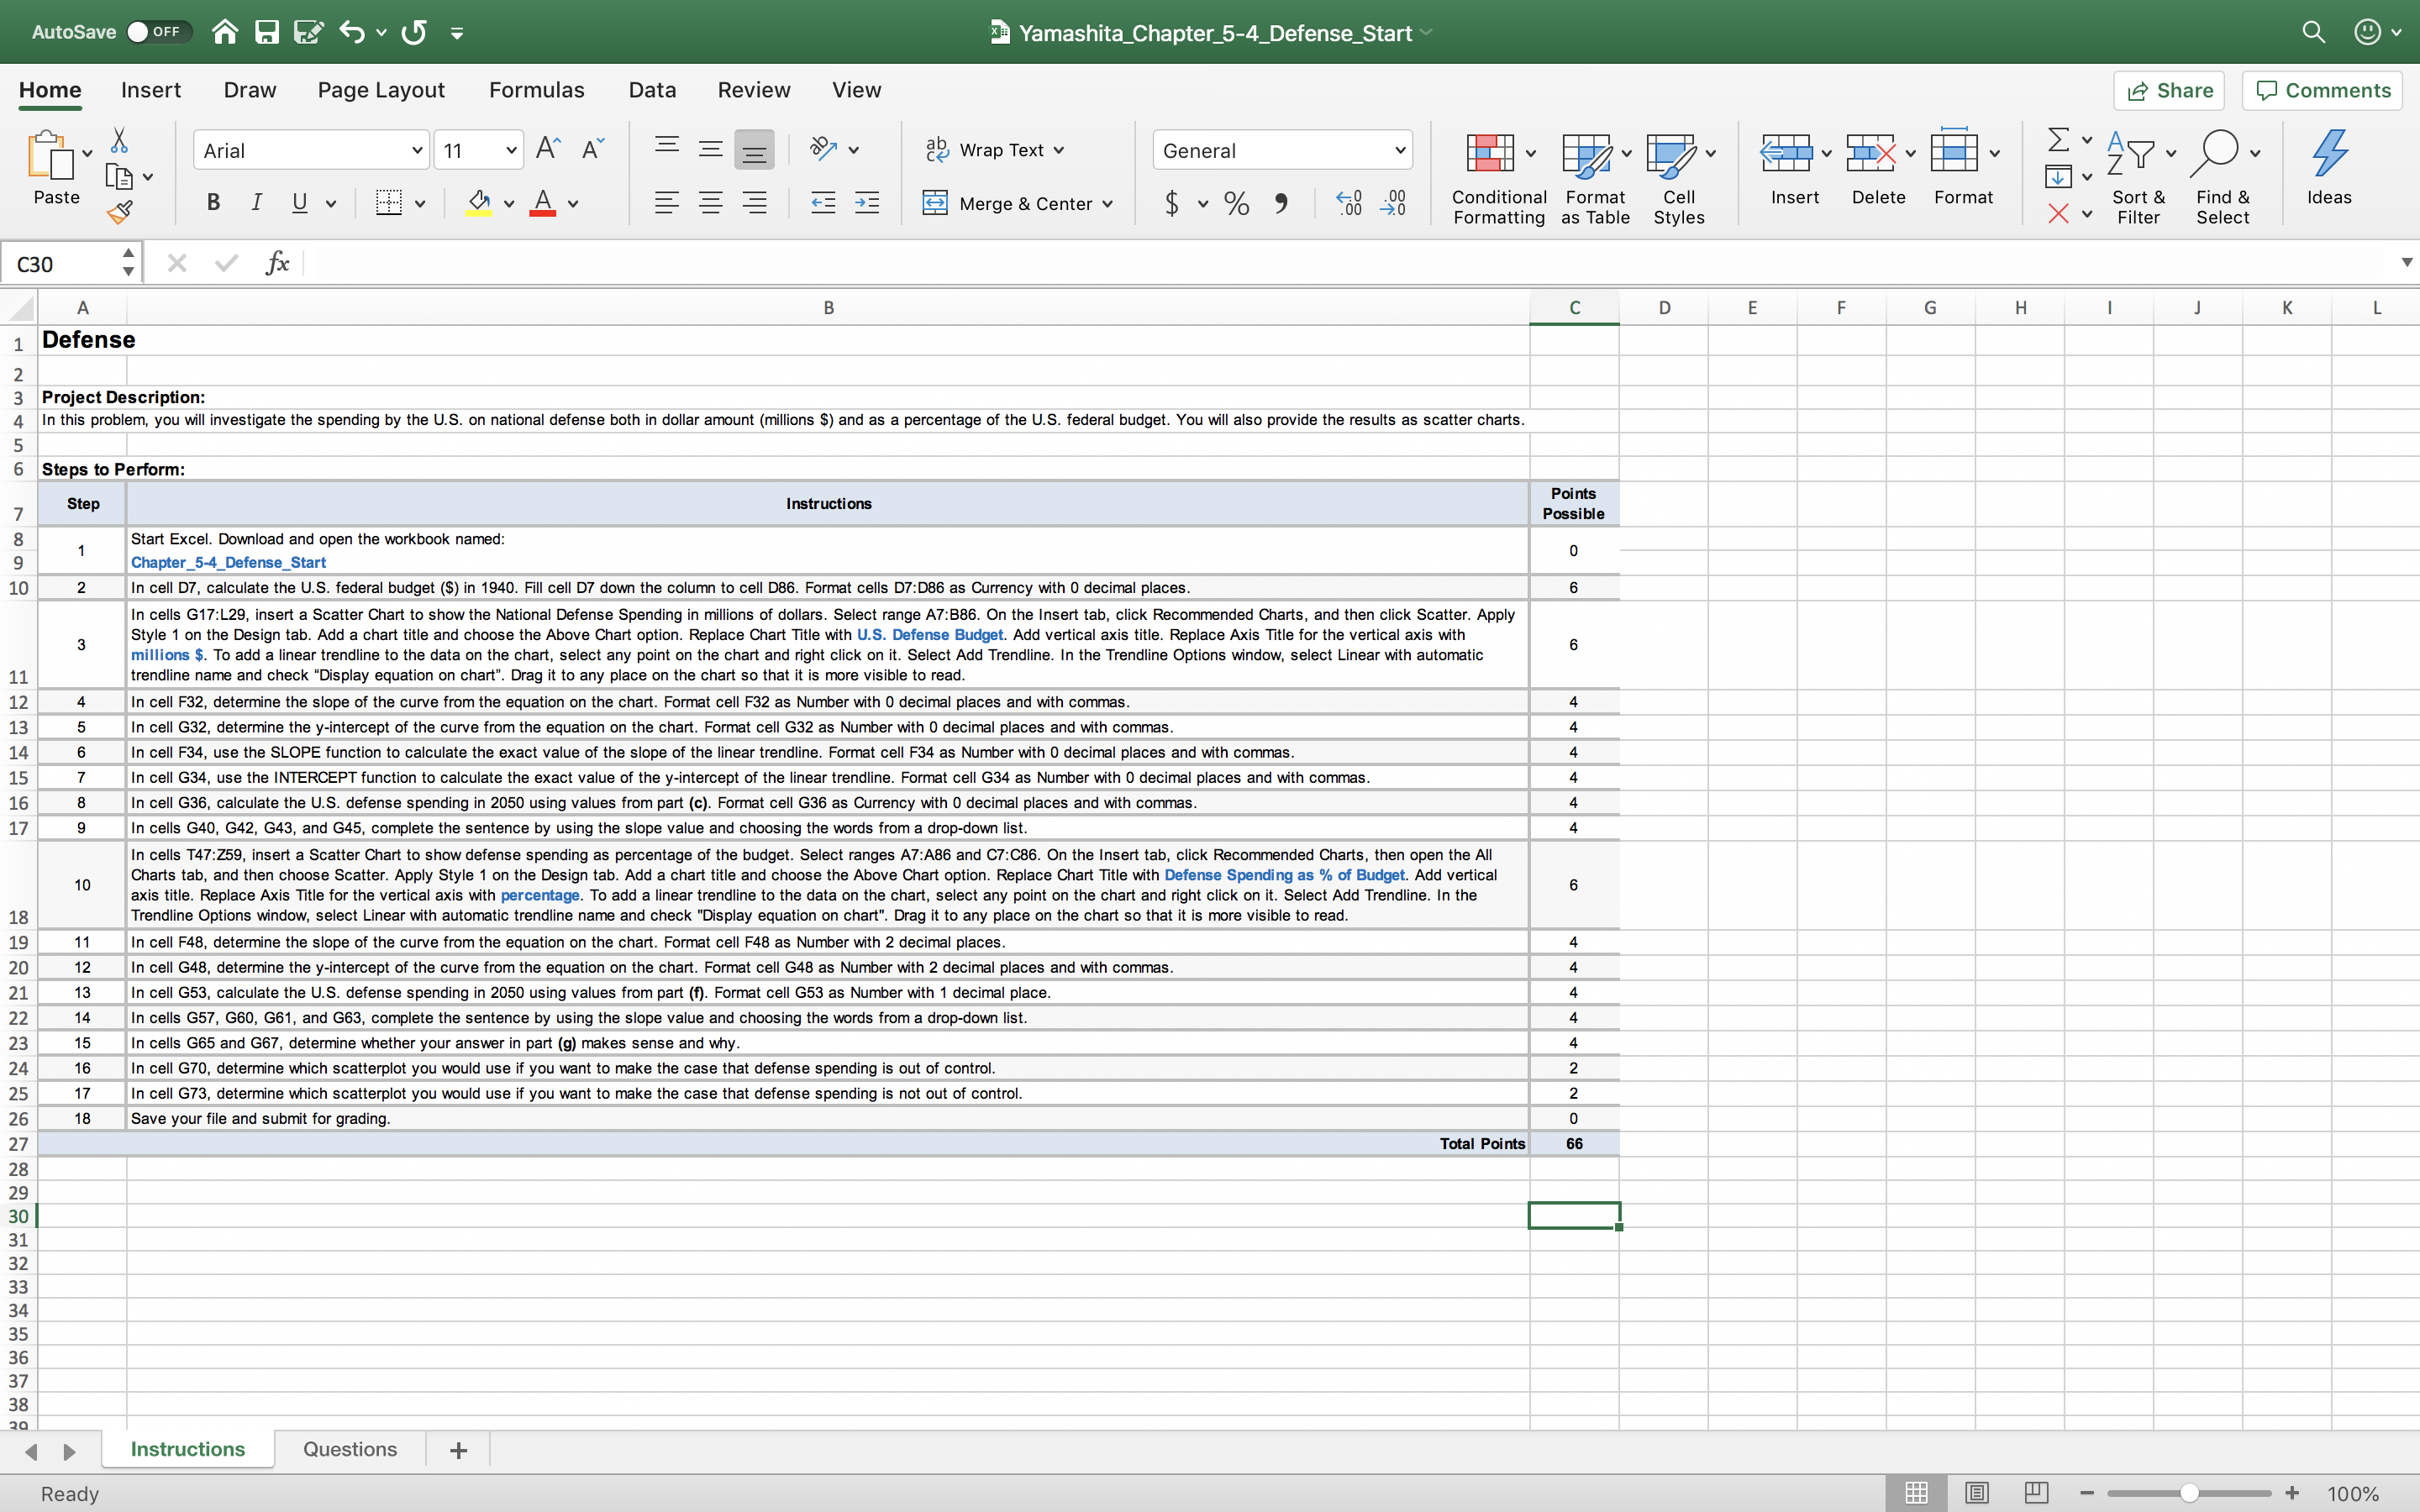
AutoSave OFF 3Yamashita_Chapter_6-2_Spill_Start Home Insert Draw Page Layout Formulas Data Review View Calibri (Body) v 11 AA de Wrap Text v General Paste B IUV MvAv Merge & Center v $ ~ % 9 Conditional Format Cell Insert Formatting as Table Styles E10 X V fx C D E G H K L M N o P Q R S T AC Use a cell reference or a single formula where appropriate in order to receive full credit. Do not copy and paste values or type values, unless directed otherwise, as you will not receive full credit for your answers. U V W X Y Z AA AB 3 A chemical spill has resulted in contaminated drinking water with 20 parts per billion (ppb) of the contaminant. A measurement of 20 ppb means for every 1,000,000,000 parts of a quantity of water (H20 molecules), 20 of 4 those parts are contaminant molecules. One day later, the level of contaminant is down to 16 ppb a . Rate: -0.2 Factor: 0 .8 a.) What is the daily decay rate? Format as Percentage to 0 decimal places. What is the decay b.) actor? Format as Number to 2 decimal places. 10 Day Contaminant (ppb) 11 20 16 b.) Create a table of values assuming the contaminant dissipates at this constant rate each 13 day. Format each value as Number to 3 decimal places 14 12.8 10.24 8.19 Gone? 6.55 C.) 3 days no c.) How long (whole number of days) until the contaminant is "gone" (less than 1 ppb)? Will it ever be completely gone? Meaning 0 ppb? Answer yes or no. 5.24 4.19 3.36 d.) Graph this table from part b as a scatterplot, insert an exponential trendline and display its 2.68 equation. Axis labels and title should be chosen from the list: 2.15 a. Days since spill 1.72 b. Parts per billion 1.37 c. Contaminant (ppb) 1.1 .88 decimal % 0.7 e.) 0.22 22% 0.56 .) What is the continuous decay rate? Format as Number to 4 decimal places and as Percentage to 2 decimal places. 0.45 0.36 f. 55 0.29 Input Days: Output Amount: 0.23 f.) Given the input cell for days, create an output cell for the amount of contaminant using the 0.18 initial value and decay factor from part a. Format as Number to 5 decimal places. 0.15 0.12 g.) The 0.09 0.08 is changing by g.) Interpret the daily decay rate from part a by filling in the following sentence: 0.06 The _i is changing by _ ii _ per _iii 0.05 per 0.04 0.03 0.02 h. ) Input Days: 55 0.02 Output Amount: 0.02 h.) Given the input cell for days, create an output cell for the amount of contaminant using 0.01 he initial value and continuous decay rate from part e. Format as Number to 5 decimal places. Note: To raise e to a power, use the EXP function. 0.01 0.01 The 0.01 is changing continuously by i.) Interpret the continuous decay rate from part e by filling in the following sentence: The _i_is changing continuously by _ _ per _ii per iiiAutoSave OFF 3 Yamashita_Chapter_5-4_Defense_Start Q Q v Home Insert Draw Page Layout Formulas Data Review View Share Comments Arial v 11 AA Wrap Text v General EX AP- O. 4 Paste BIU BY DVAv E E Merge & Center v $ ~ % " Conditional Format Cell Insert Delete Format Formatting as Table Styles X v Sort & Find & Ideas Filter Select C30 X V fx B C D E F G H I K Defense n DWN Project Description: In this problem, you will investigate the spending by the U.S. on national defense both in dollar amount (millions $) and as a percentage of the U.S. federal budget. You will also provide the results as scatter charts. 6 Steps to Perform: Step Instructions Points Possible Start Excel. Download and open the workbook named: Chapter_5-4_Defense_Start 0 2 In cell D7, calculate the U.S. federal budget ($) in 1940. Fill cell D7 down the column to cell D86. Format cells D7:D86 as Currency with 0 decimal places. 6 In cells G17:L29, insert a Scatter Chart to show the National Defense Spending in millions of dollars. Select range A7:B86. On the Insert tab, click Recommended Charts, and then click Scatter. Apply 3 Style 1 on the Design tab. Add a chart title and choose the Above Chart option. Replace Chart Title with U.S. Defense Budget. Add vertical axis title. Replace Axis Title for the vertical axis with millions $. To add a linear trendline to the data on the chart, select any point on the chart and right click on it. Select Add Trendline. In the Trendline Options window, select Linear with automatic 11 trendline name and check "Display equation on chart". Drag it to any place on the chart so that it is more visible to read. 12 In cell F32, determine the slope of the curve from the equ 13 tion on the chart. Format cell F32 as Number with 0 decimal places and with commas. 14 In cell G32, determine the y-intercept of the curve from the equation on the chart. Format cell G32 as Number with 0 decimal places and with commas. In cell F34, use the SLOPE function to calculate the exact value of the slope of the linear trendline. Format cell F34 as Number with 0 decimal places and with commas. 15 In cell G34, use the INTERCEPT function to calculate the exact value of the y-intercept of the linear trendline. Format cell G34 as Number with 0 decimal places and with commas. 16 In cell G36, calculate the U.S. defense spending in 2050 using values from part (c). Format cell G36 as Currency with 0 decimal places and with commas 17 In cells G40, G42, G43, and G45, complete the sentence by using the slope value and choosing the words from a drop-down list. In cells T47:259, insert a Scatter Chart to show defense spending as percentage of the budget. Select ranges A7:A86 and C7:086. On the Insert tab, click Recommended Charts, then open the All 10 Charts tab, and then choose Scatter. Apply Style 1 on the Design tab. Add a chart title and choose the Above Chart option. Replace Chart Title with Defense Spending as % of Budget. Add vertical axis title. Replace Axis Title for the vertical axis with percentage. To add a linear trendline to the data on the chart, select any point on the chart and right click on it. Select Add Trendline. In the 18 Trendline Options window, select Linear with automatic trendline name and check "Display equation on chart". Drag it to any place on the chart so that it is more visible to read. 19 11 In cell F48, determine the slope of the curve from the equation on the chart. Format cell F48 as Number with 2 decimal places. 20 12 In cell G48, determine the y-intercept of the curve from the equation on the chart. Format cell G48 as Number with 2 decimal places and with commas. 21 13 In cell G53, calculate the U.S. defense spending in 2050 using values from part (f). Format cell G53 as Number with 1 decimal place. 22 14 23 In cells G57, G60, G61, and G63, complete the sentence by using the slope value and choosing the words from a drop-down list 15 In cells G65 and G67, determine whether your answer in part (9) makes sense and why. 24 16 In cell G70, determine which scatterplot you would use if you want to make the case that defense spending is out of control. 25 17 In cell G73, determine which scatterplot you would use if you want to make the case that defense spending is not out of control. 26 18 Save your file and submit for grading. NN 0 27 Total Points 66 28 29 30 31 32 33 34 35 36 37 38 20 D Instructions Questions + Ready + 100%
Step by Step Solution
There are 3 Steps involved in it
Lets tackle each assignment stepbystep Chapter 62 Spill a Daily Decay Rate and Factor Daily Decay Rate The rate given is 02 To convert to percentage 0... View full answer

Get step-by-step solutions from verified subject matter experts