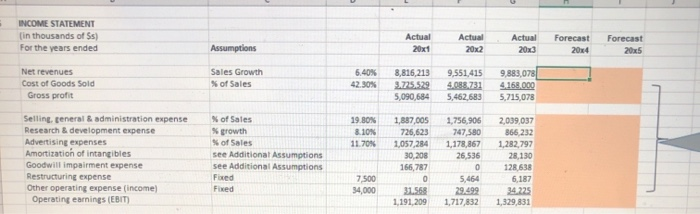
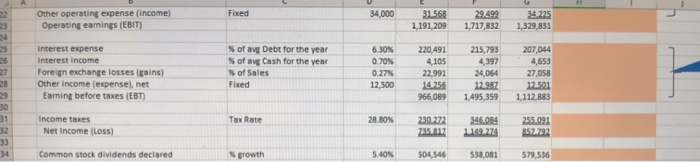
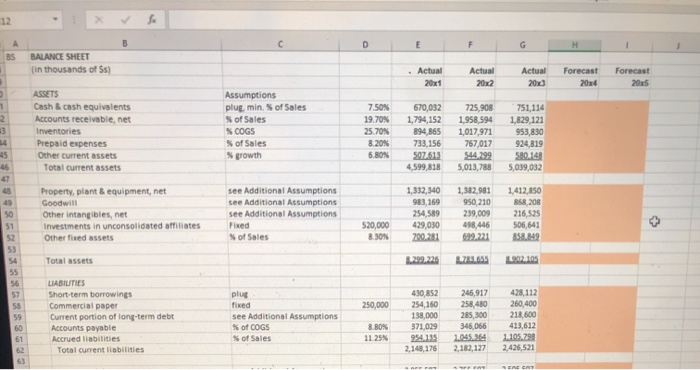
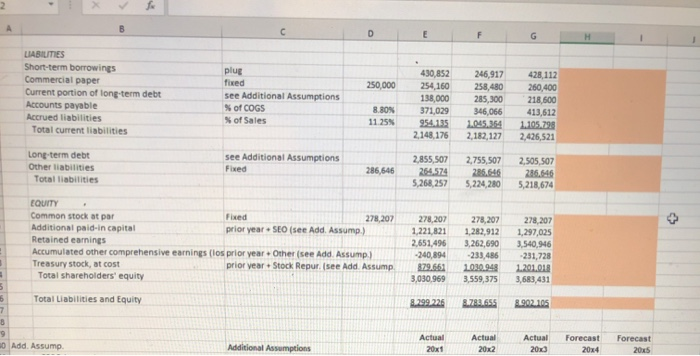
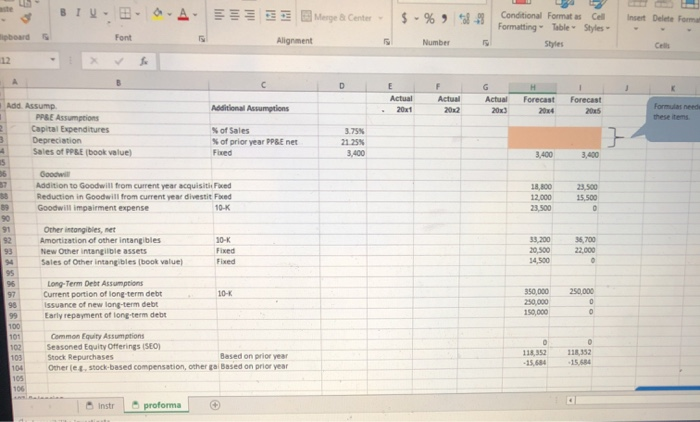
i'm looking for a basic equations to help me with the missing answers in columns H and I.
INCOME STATEMENT (in thousands of $s) For the years ended Assumptions Actual 20x1 Actual 20x2 Actual 20x3 Forecast 204 Forecast 2025 Net revenues Cost of Goods Sold Gross profit Sales Growth % of Sales 6.40% 42.30% 8,816,213 9.75.529 5,090,684 9,551,415 4.088.731 5,462,683 9,883,078 4.168.000 5,715,078 19.80N 8.10% 11.70% Selling, teneral & administration expense Research & development expense Advertising expenses Amortization of intangibles Goodwill impairment expense Restructuring expense Other operating expense (income) Operating earnings (EBIT) of Sales % growth of Sales see Additional Assumptions see Additional Assumptions Fixed Fixed 1,887,005 726,623 1,057,284 30,208 166,787 0 31.56 1,191,209 1,756,906 747,580 1,178,867 26,536 0 5,464 29.499 1,717,832 2,039,037 866.232 1,282,797 28,130 128 638 6.187 34.223 1,329,831 7.500 34,000 INCOME STATEMENT (in thousands of Ss) For the years ended Assumptions Actual 20x1 Actual 20x2 Actual 20x3 Forecast 204 Forecast 20x5 Net revenues Cost of Goods Sold Gross profit Sales Growth % of Sales 42.30% 8,816,213 3.725.529 5,090,684 9,551,415 4.088,731 5,462,683 9,883,078 4.168.000 5,715,078 19.80% 8.10% 11.70% Selling teneral & administration expense Research & development expense Advertising expenses Amortization of intangibles Goodwill impairment expense Restructuring expense Other operating expense (income) Operating earnings (EBIT) of Sales % growth of Sales see Additional Assumptions see Additional Assumptions Fixed Fixed 1,887,005 726,623 1,057,284 30,208 166,787 0 31.568 1,191,209 1,756,906 747,580 1,178,867 26,536 0 5,464 29.499 1,717,832 2,039,037 866.232 1,282,797 28,130 128,638 6,187 34.223 1,329,831 7.500 34,000 Fixed 34,000 Other operating expense (income) Operating earnings (EBIT) 31.568 1,191,209 29.499 1,717,832 34.225 1,329,831 25 26 27 28 29 30 31 32 Interest expense Interest income Foreign exchange losses (gains) Other income (expense), net Earning before taxes (EBT) % of avg Debt for the year % of avg Cash for the year of Sales Fixed 6.30% 0.70% 0.27% 12,500 220,491 4105 22.991 14.256 966,089 215,793 4,397 24,064 12.987 1.495,359 207,044 4,653 27,058 12.501 1,112,883 Tax Rate 28.80% Income taxes Net Income (LOS) 230.272 2851817 346.084 1149.274 255.091 857.792 34 Common stock dividends declared growth 5.40% 504,546 538,081 579,536 12 B F G H 1 A BS BALANCE SHEET (in thousands of Ss) Actual Actual 20x2 Actual 200 Forecast 2024 Forecast 2025 1 2 3 ASSETS Cash & cash equivalents Accounts receivable, net Inventories Prepaid expenses Other current assets Total current assets Assumptions plug, min of Sales S of Sales SCOGS of Sales growth 7.50% 19.70 25.70% 8.20N 5.80N 670,082 1,794,152 894,865 733,156 507,513 4,599,818 725,908 1,958,594 1,017,971 767,017 544.299 5,013,788 751,114 1,829,121 953,830 924,819 580.148 5,039,032 45 46 40 50 51 52 53 Property, plant & equipment, net Goodwill Other intangibles, net Investments in unconsolidated affiliates Other fixed assets see Additional Assumptions see Additional Assumptions see Additional Assumptions Fixed of Sales 1,332,340 963, 169 254,589 429,030 200.281 1,382,981 950, 210 239,009 498,446 899.221 1,412,850 858 208 216,525 506,641 858.849 520,000 8.30N Total assets 3.299.226 3.902105 55 56 57 58 59 60 61 250,000 LIABILITIES Short-term borrowings Commercial paper Current portion of long-term debt Accounts payable Accrued liabilities Total current liabilities plus fixed see Additional Assumptions % of COGS of Sales 430,852 254,160 138,000 371,029 954.135 2,148,176 246,917 258,480 285,300 346,066 1.045,364 2,182,127 428,112 260,400 218,600 413,612 8.80% 11.25 2,426,521 SENE ENT 2 B D E F G 250,000 LIABILITIES Short-term borrowings Commercial paper Current portion of long-term debt Accounts payable Accrued liabilities Total current liabilities plug fixed see Additional Assumptions % of COGS % of Sales 430,852 254,160 138,000 371,029 954.135 2.148,176 8.80N 11.25% 246,917 258,480 285,300 346,066 1.045.364 2,182,127 428.112 260,400 218,600 413,612 1.105,798 2,426,521 Long-term debt Other liabilities Total liabilities see Additional Assumptions Fixed 286,646 2,855,507 264.574 5,268,257 2,755,507 286.646 5,224,280 2,505,507 286.646 5,218,674 EQUITY Common stock at par Fixed 278,207 Additional paid in capital prior year. SEO (see Add. Assump.) Retained earnings Accumulated other comprehensive earnings (los prior year. Other (see Add. Assump) Treasury stock, at cost prior year. Stock Repur (see Add. Assump Total shareholders' equity 5 6 Total Liabilities and Equity 7 8 9 Add. Assump Additional Assumptions 278,207 1,221,8 2,651,496 -240,894 879.663 3,030,969 278,207 1,282,912 3,262,690 -233,486 1030948 3,559,375 278,207 1,297,025 3,540,96 -231,728 1.201018 3,683,431 8.299.226 8.782.655 8.902105 Actual 20x1 Actual 20x2 Actual 20 Forecast Forecast 2015 2004 BI Merge Center $ -% % -3 Insert Delete Form Conditional Formatas Cell Formatting Table Styles Styles board Font Alignment Number 12 A D F K E Actual 20x1 Actual 20x2 Actual 20x3 Forecast 204 Forecast 2015 Formulas need theses } 21.25% 3,400 3,400 3,400 Add. Assump Additional Assumptions PPSE Assumptions Capital Expenditures of Sales 3 Depreciation % of prior year PPE net Sales of PPBEbook value) Fixed is 55 Goodwill Addition to Goodwill from current year acquisitioned Reduction in Goodwill from current year divestit Food 59 Goodwill impairment expense 10-K 18.00 12,000 23.500 23.500 15,500 91 Other intangibles, net Amortization of other intangibles New Other intangible assets Sales of Other intangibles (book value) 10- Fixed Fixed 33.200 20,500 34,500 36,700 22.000 94 95 96 97 98 10- Long-Term Debt Assumptions Current portion of long-term debt Issuance of new long-term debt Early repayment of long-term debt 350,000 250,000 150,000 250,000 0 0 100 101 102 103 104 105 106 Common Equity Assumptions Seasoned Equity Offerings (SEO) Stock Repurchases Based on prior year Othere.stock-based compensation, other gal Based on prior year 0 118,352 -15684 -15684 Instr proforma