I'm not sure how to solve this using StatCrunch???
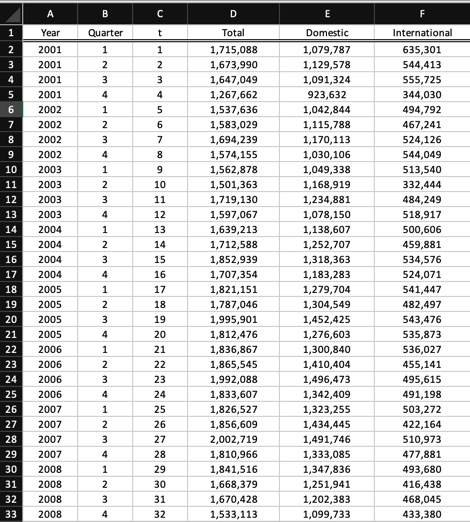
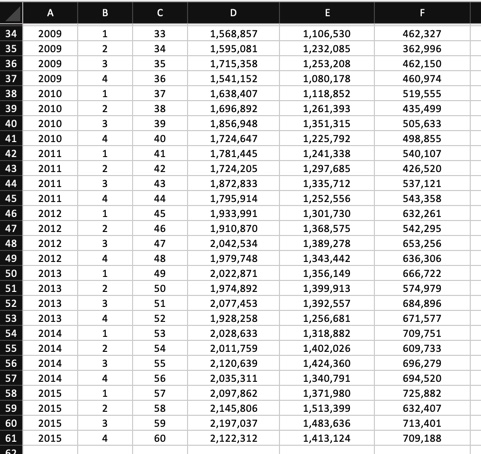
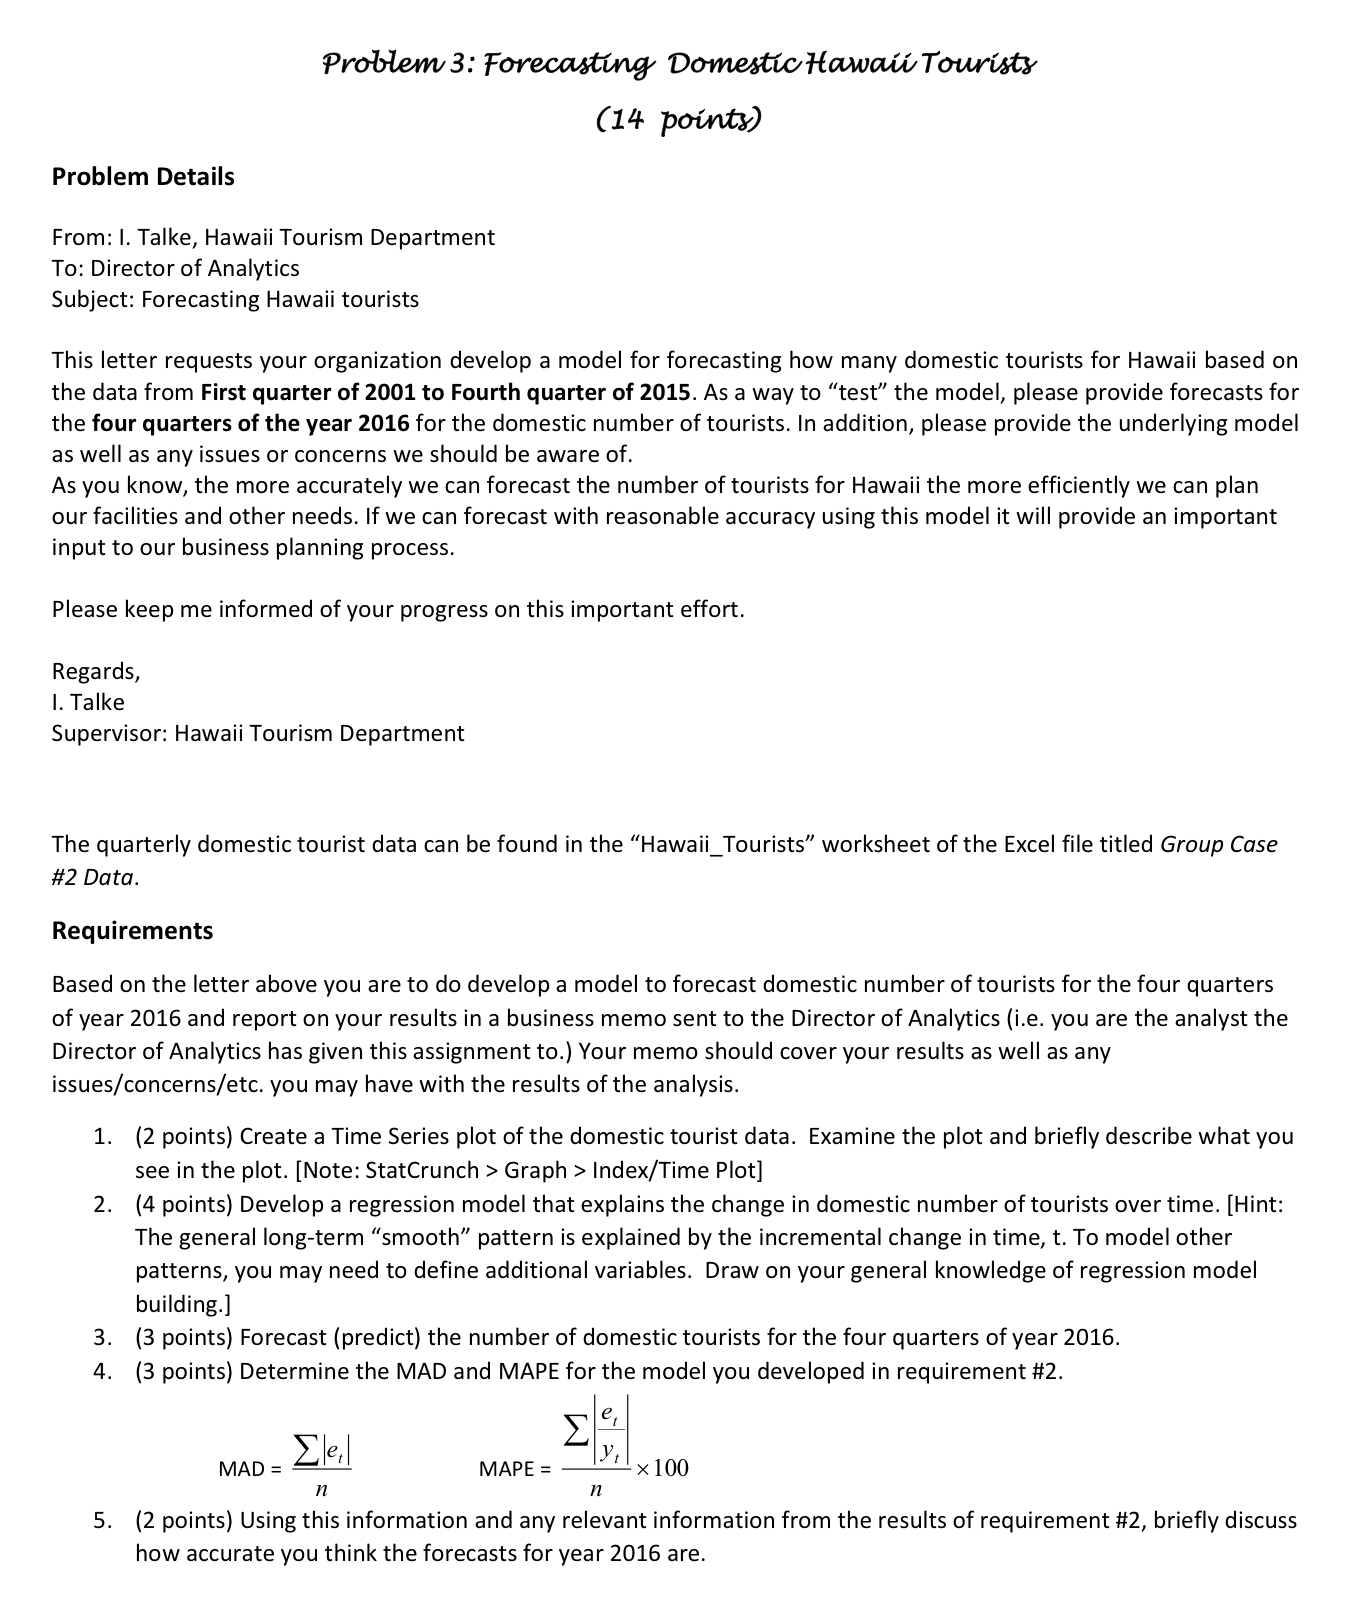
\f\fProblemS: 170:me Domomvmi'owm (14L pointy) Problem Details From: I. Talke, Hawaii Tourism Department To: Director of Analytics Subject: Forecasting Hawaii tourists This letter requests your organization develop a model for forecasting how many domestic tourists for Hawaii based on the data from First quarter of 2001 to Fourth quarter of 2015. As a way to \"test\" the model, please provide forecasts for the four quarters of the year 2016 for the domestic number of tourists. In addition, please provide the underlying model as well as any issues or concerns we should be aware of. As you know, the more accurately we can forecast the number of tourists for Hawaii the more efficiently we can plan our facilities and other needs. If we can forecast with reasonable accuracy using this model it will provide an important input to our business planning process. Please keep me informed of your progress on this important effort. Regards, I. Talke Supervisor: Hawaii Tourism Department The quarterly domestic tourist data can be found in the "Hawaii_Tourists\" worksheet of the Excel file titled Group Case #2 Data. Requirements Based on the letter above you are to do develop a model to forecast domestic number of tourists for the four quarters of year 2016 and report on your results in a business memo sent to the Director of Analytics (Le. you are the analyst the Director ofAnalytics has given this assignment to.) Your memo should cover your results as well as any issues/concerns/etc. you may have with the results ofthe analysis. 1. {2 points) Create a Time Series plot ofthe domestic tourist data. Examine the plot and briefly describe what you see in the plot. [Note: StatCrunch > Graph > Index/Time Plot] 2. (4 points) Develop a regression model that explains the change in domestic number of tourists over time. [Hint: The general long-term "smooth" pattern is explained by the incremental change in time, t. To model other patterns, you may need to dene additional variables. Draw on your general knowledge of regression model building] 3. (3 points) Forecast (predict) the number of domestic tourists for the four quarters of year 2015. 4. (3 points) Determine the MAD and MAPE for the model you developed in requirement #2. e 2 is Z 'e'| MAPE = y' n n 5. {2 points) Using this information and any relevant information from the results of requirement #2, briefly discuss how accurate you think the forecasts for year 2016 are. MAD = X100


