I'm not sure if the answers I already selected are correct or not, but I tried my best. Can somebody help please? :)

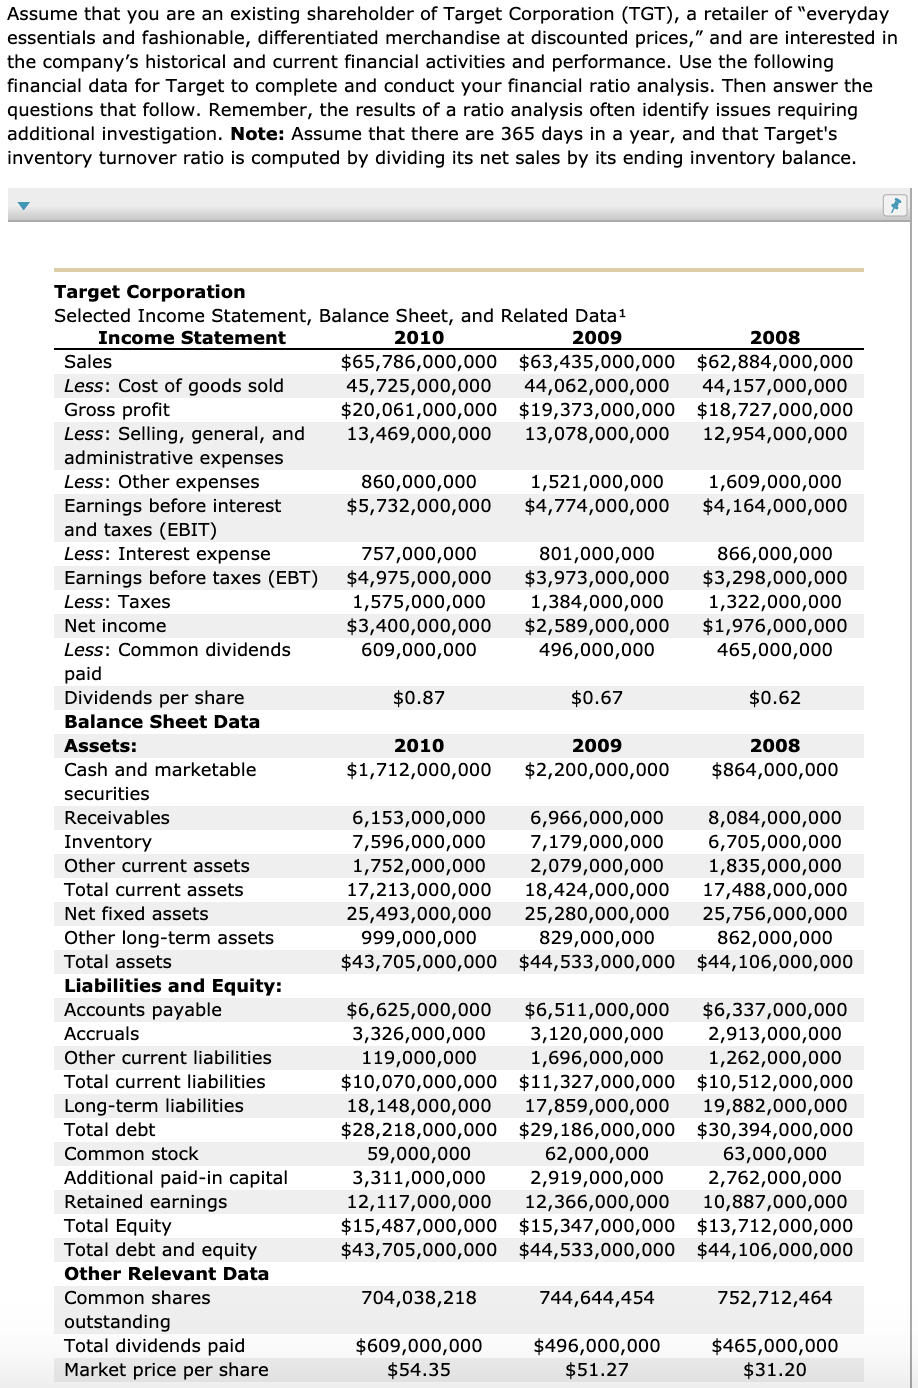
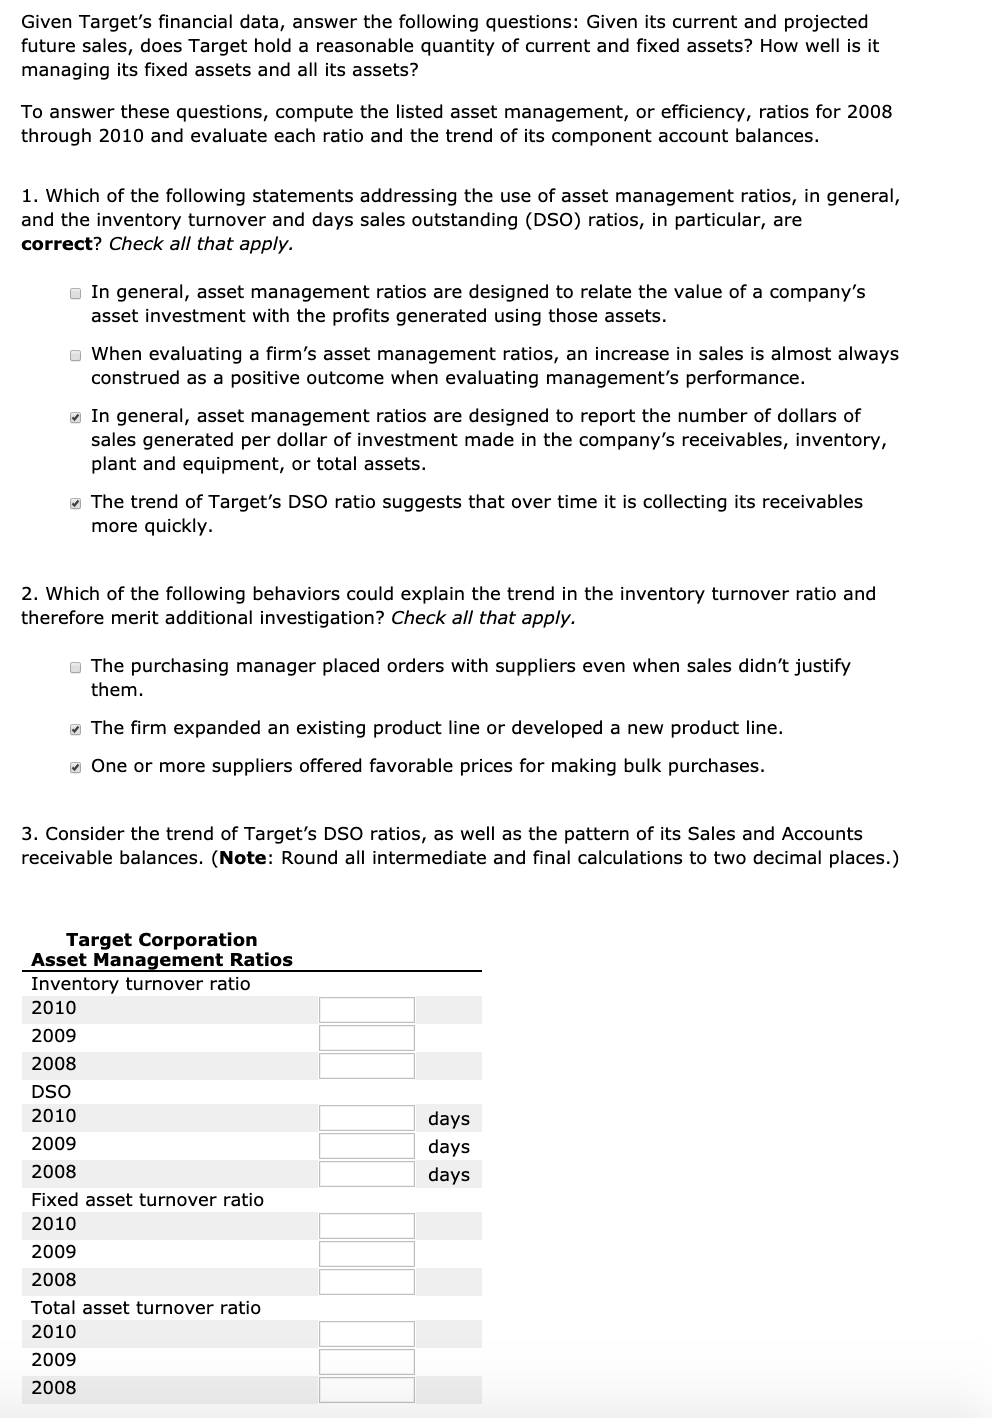
Assume that you are an existing shareholder of Target Corporation (TGT), a retailer of "everyday essentials and fashionable, differentiated merchandise at discounted prices," and are interested in the company's historical and current financial activities and performance. Use the following financial data for Target to complete and conduct your financial ratio analysis. Then answer the questions that follow. Remember, the results of a ratio analysis often identify issues requiring additional investigation. Note: Assume that there are 365 days in a year, and that Target's inventory turnover ratio is computed by dividing its net sales by its ending inventory balance. Target Corporation Selected Income Statement, Balance Sheet, and Related Data1 Income Statement 2010 2009 2008 Sales $65,786,000,000 $63,435,000,000 $62,884,000,000 Less: Cost of goods sold 45,725,000,000 44,062,000,000 44,157,000,000 Gross profit $20,061,000,000 $19,373,000,000 $18,727,000,000 Less: Selling, general, and 13,469,000,000 13,078,000,000 12,954,000,000 administrative expenses Less: Other expenses 860,000,000 1,521,000,000 1,609,000,000 Earnings before interest $5,732,000,000 $4,774,000,000 $4,164,000,000 and taxes (EBIT) Less: Interest expense 757,000,000 801,000,000 866,000,000 Earnings before taxes (EBT) $4,975,000,000 $3,973,000,000 $3,298,000,000 Less: Taxes 1,575,000,000 1,384,000,000 1,322,000,000 Net income $3,400,000,000 $2,589,000,000 $1,976,000,000 Less: Common dividends 609,000,000 496,000,000 465,000,000 paid Dividends per share $0.87 $0.67 $0.62 Balance Sheet Data Assets: 2010 2009 2008 Cash and marketable $1,712,000,000 $2,200,000,000 $864,000,000 securities Receivables 6,153,000,000 6,966,000,000 8,084,000,000 Inventory 7,596,000,000 7,179,000,000 6,705,000,000 Other current assets 1,752,000,000 2,079,000,000 1,835,000,000 Total current assets 17,213,000,000 18,424,000,000 17,488,000,000 Net fixed assets 25,493,000,000 25,280,000,000 25,756,000,000 Other long-term assets 999,000,000 829,000,000 862,000,000 Total assets $43,705,000,000 $44,533,000,000 $44,106,000,000 Liabilities and Equity: Accounts payable $6,625,000,000 $6,511,000,000 $6,337,000,000 Accruals 3,326,000,000 3,120,000,000 2,913,000,000 Other current liabilities 119,000,000 1,696,000,000 1,262,000,000 Total current liabilities $10,070,000,000 $11,327,000,000 $10,512,000,000 Long-term liabilities 18,148,000,000 17,859,000,000 19,882,000,000 Total debt $28,218,000,000 $29,186,000,000 $30,394,000,000 Common stock 59,000,000 2,000,000 63,000,000 Additional paid-in capital 3,311,000,000 2,919,000,000 2,762,000,000 Retained earnings 12,117,000,000 12,366,000,000 10,887,000,000 Total Equity $15,487,000,000 $15,347,000,000 $13,712,000,000 Total debt and equity $43,705,000,000 $44,533,000,000 $44,106,000,000 Other Relevant Data Common shares 704,038,218 744,644,454 752,712,464 outstanding Total dividends paid $609,000,000 $496,000,000 $465,000,000 Market price per share $54.35 $51.27 $31.20 Given Target's financial data, answer the following questions: Given its current and projected future sales, does Target hold a reasonable quantity of current and fixed assets? How well is it managing its fixed assets and all its assets? To answer these questions, compute the listed asset management, or efficiency, ratios for 2008 through 2010 and evaluate each ratio and the trend of its component account balances. 1. Which of the following statements addressing the use of asset management ratios, in general, and the inventory turnover and days sales outstanding (DSO) ratios, in particular, are correct? Check all that apply. In general, asset management ratios are designed to relate the value of a company's asset investment with the profits generated using those assets. When evaluating a firm's asset management ratios, an increase in sales is almost always construed as a positive outcome when evaluating management's performance. In general, asset management ratios are designed to report the number of dollars of sales generated per dollar of investment made in the company's receivables, inventory, plant and equipment, or total assets. The trend of Target's DSO ratio suggests that over time it is collecting its receivables more quickly. 2. Which of the following behaviors could explain the trend in the inventory turnover ratio and therefore merit additional investigation? Check all that apply. The purchasing manager placed orders with suppliers even when sales didn't justify them. The firm expanded an existing product line or developed a new product line. One or more suppliers offered favorable prices for making bulk purchases. 3. Consider the trend of Target's DSO ratios, as well as the pattern of its Sales and Accounts receivable balances. (Note: Round all intermediate and final calculations to two decimal places.) Target Corporation Asset Management Ratios Inventory turnover ratio 2010 2009 2008 DSO 2010 2009 2008 Fixed asset turnover ratio 2010 2009 2008 Total asset turnover ratio 2010 2009 2008 days days days


