Question
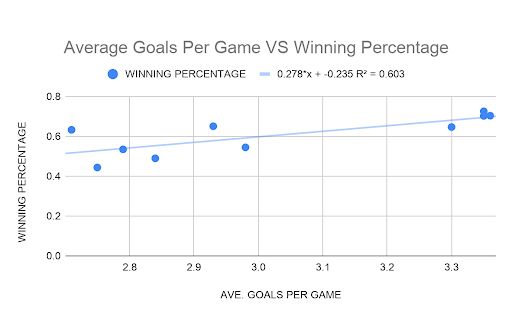
Im stressing out over these questions, can someone help me Questions: 1) Perform the following analysis of the scatter plot (Lesson 8.1) as structured in
Im stressing out over these questions, can someone help me
Questions:
1) Perform the following analysis of the scatter plot (Lesson 8.1) as structured in the
TEMPLATE:
? Determine the strength of the correlation between the two variables by calculating the
correlation coefficient, rr, and then describe this correlation and its implications
(i.e. "so what?")
? Interpret the equation of the line of best-fit ("what do the slope and yy-intercept
mean?")
? Use the line of best-fit for either interpolation or extrapolation in order to make
predictions about your topic (and discuss validity of these predictions).
2. Explore the type of relationship (Lesson 8.2) between the two variables and justify your
reasoning convincingly with other references, where appropriate, as structured in the
TEMPLATE.
? E.g. Cause and effect, common cause, presumed, accidental, reverse cause and effect
Information given:
The purpose of this report is to represent the relationship between 10 randomly selected NHL teams winning percentage versus average goals per game. The focus of this research report is geared towards determining if the average goals scored per game would ensure a greater chance of winning.

Step by Step Solution
There are 3 Steps involved in it
Step: 1

Get Instant Access to Expert-Tailored Solutions
See step-by-step solutions with expert insights and AI powered tools for academic success
Step: 2

Step: 3

Ace Your Homework with AI
Get the answers you need in no time with our AI-driven, step-by-step assistance
Get Started


