Answered step by step
Verified Expert Solution
Link Copied!

Question

1 Approved Answer

I'm stuck on what to do for this question 4.4.2 The accompanying table shows projected populations for different demographic groups. a. Compute the total change

I'm stuck on what to do for this question
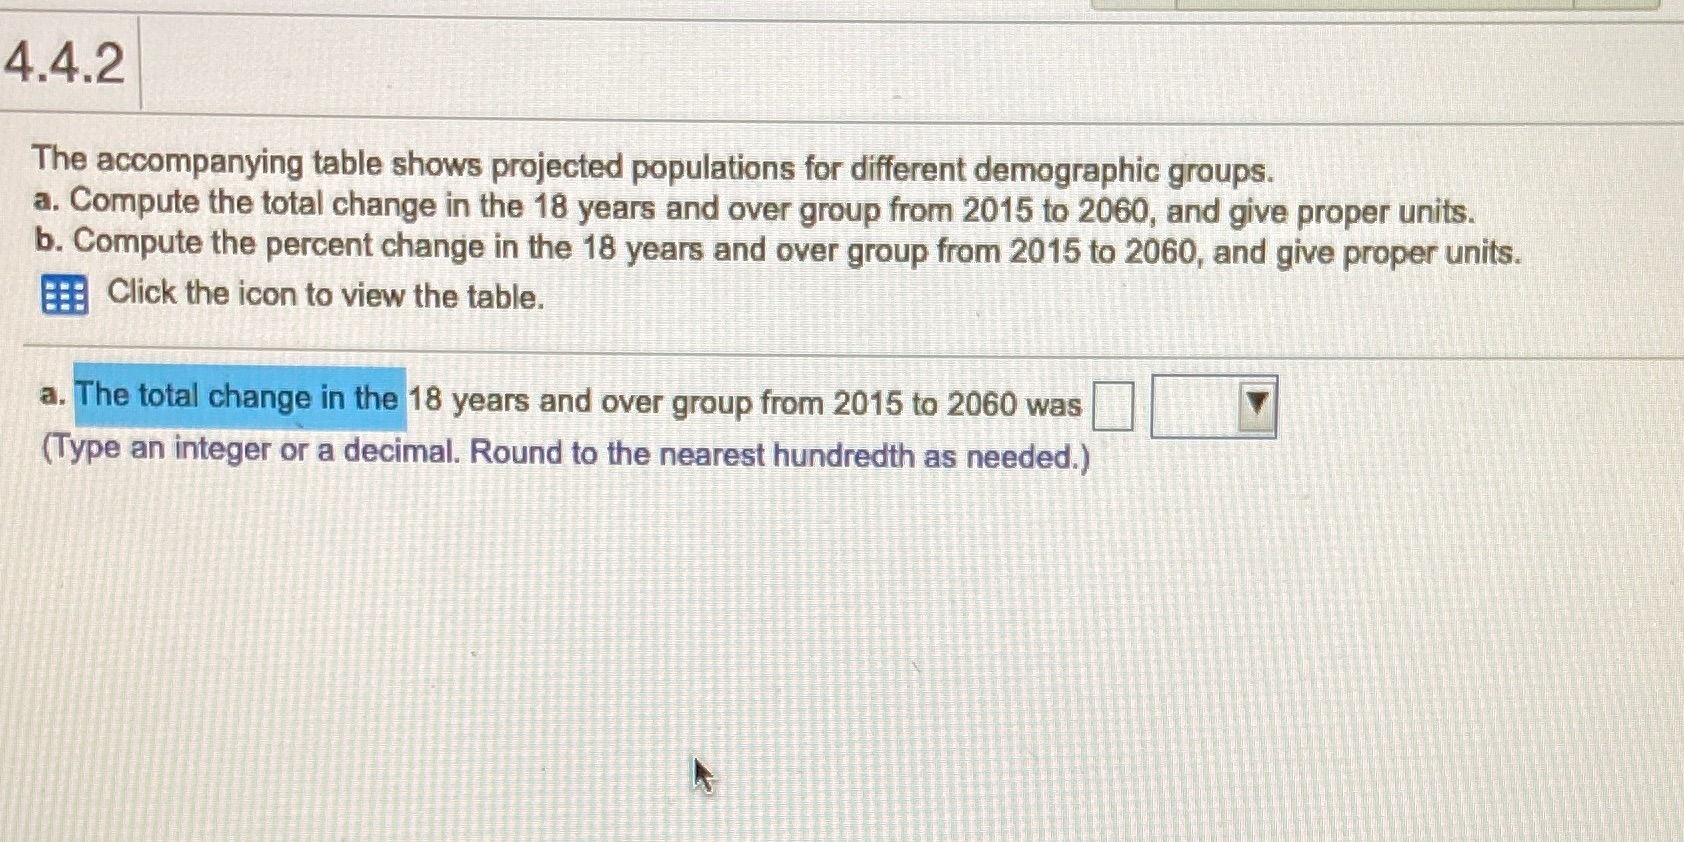
image text in transcribed
4.4.2 The accompanying table shows projected populations for different demographic groups. a. Compute the total change in the 18 years and over group from 2015 to 2060, and give proper units. b. Compute the percent change in the 18 years and over group from 2015 to 2060, and give proper units. Click the icon to view the table. a. The total change in the 18 years and over group from 2015 to 2060 was (Type an integer or a decimal. Round to the nearest hundredth as needed.)

Step by Step Solution

There are 3 Steps involved in it

Step: 1

blur-text-image

Get Instant Access to Expert-Tailored Solutions

See step-by-step solutions with expert insights and AI powered tools for academic success

Step: 2

blur-text-image_2

Step: 3

blur-text-image_3

Ace Your Homework with AI

Get the answers you need in no time with our AI-driven, step-by-step assistance

Get Started

Recommended Textbook for

Introduction to Probability

Authors: Mark Daniel Ward, Ellen Gundlach

1st edition

716771098, 978-1319060893, 1319060897, 978-0716771098

More Books

Students also viewed these Mathematics questions

Question

1. Classification of the problems under consideration.

Answered: 1 week ago