im unsure how to plot these and solve them.
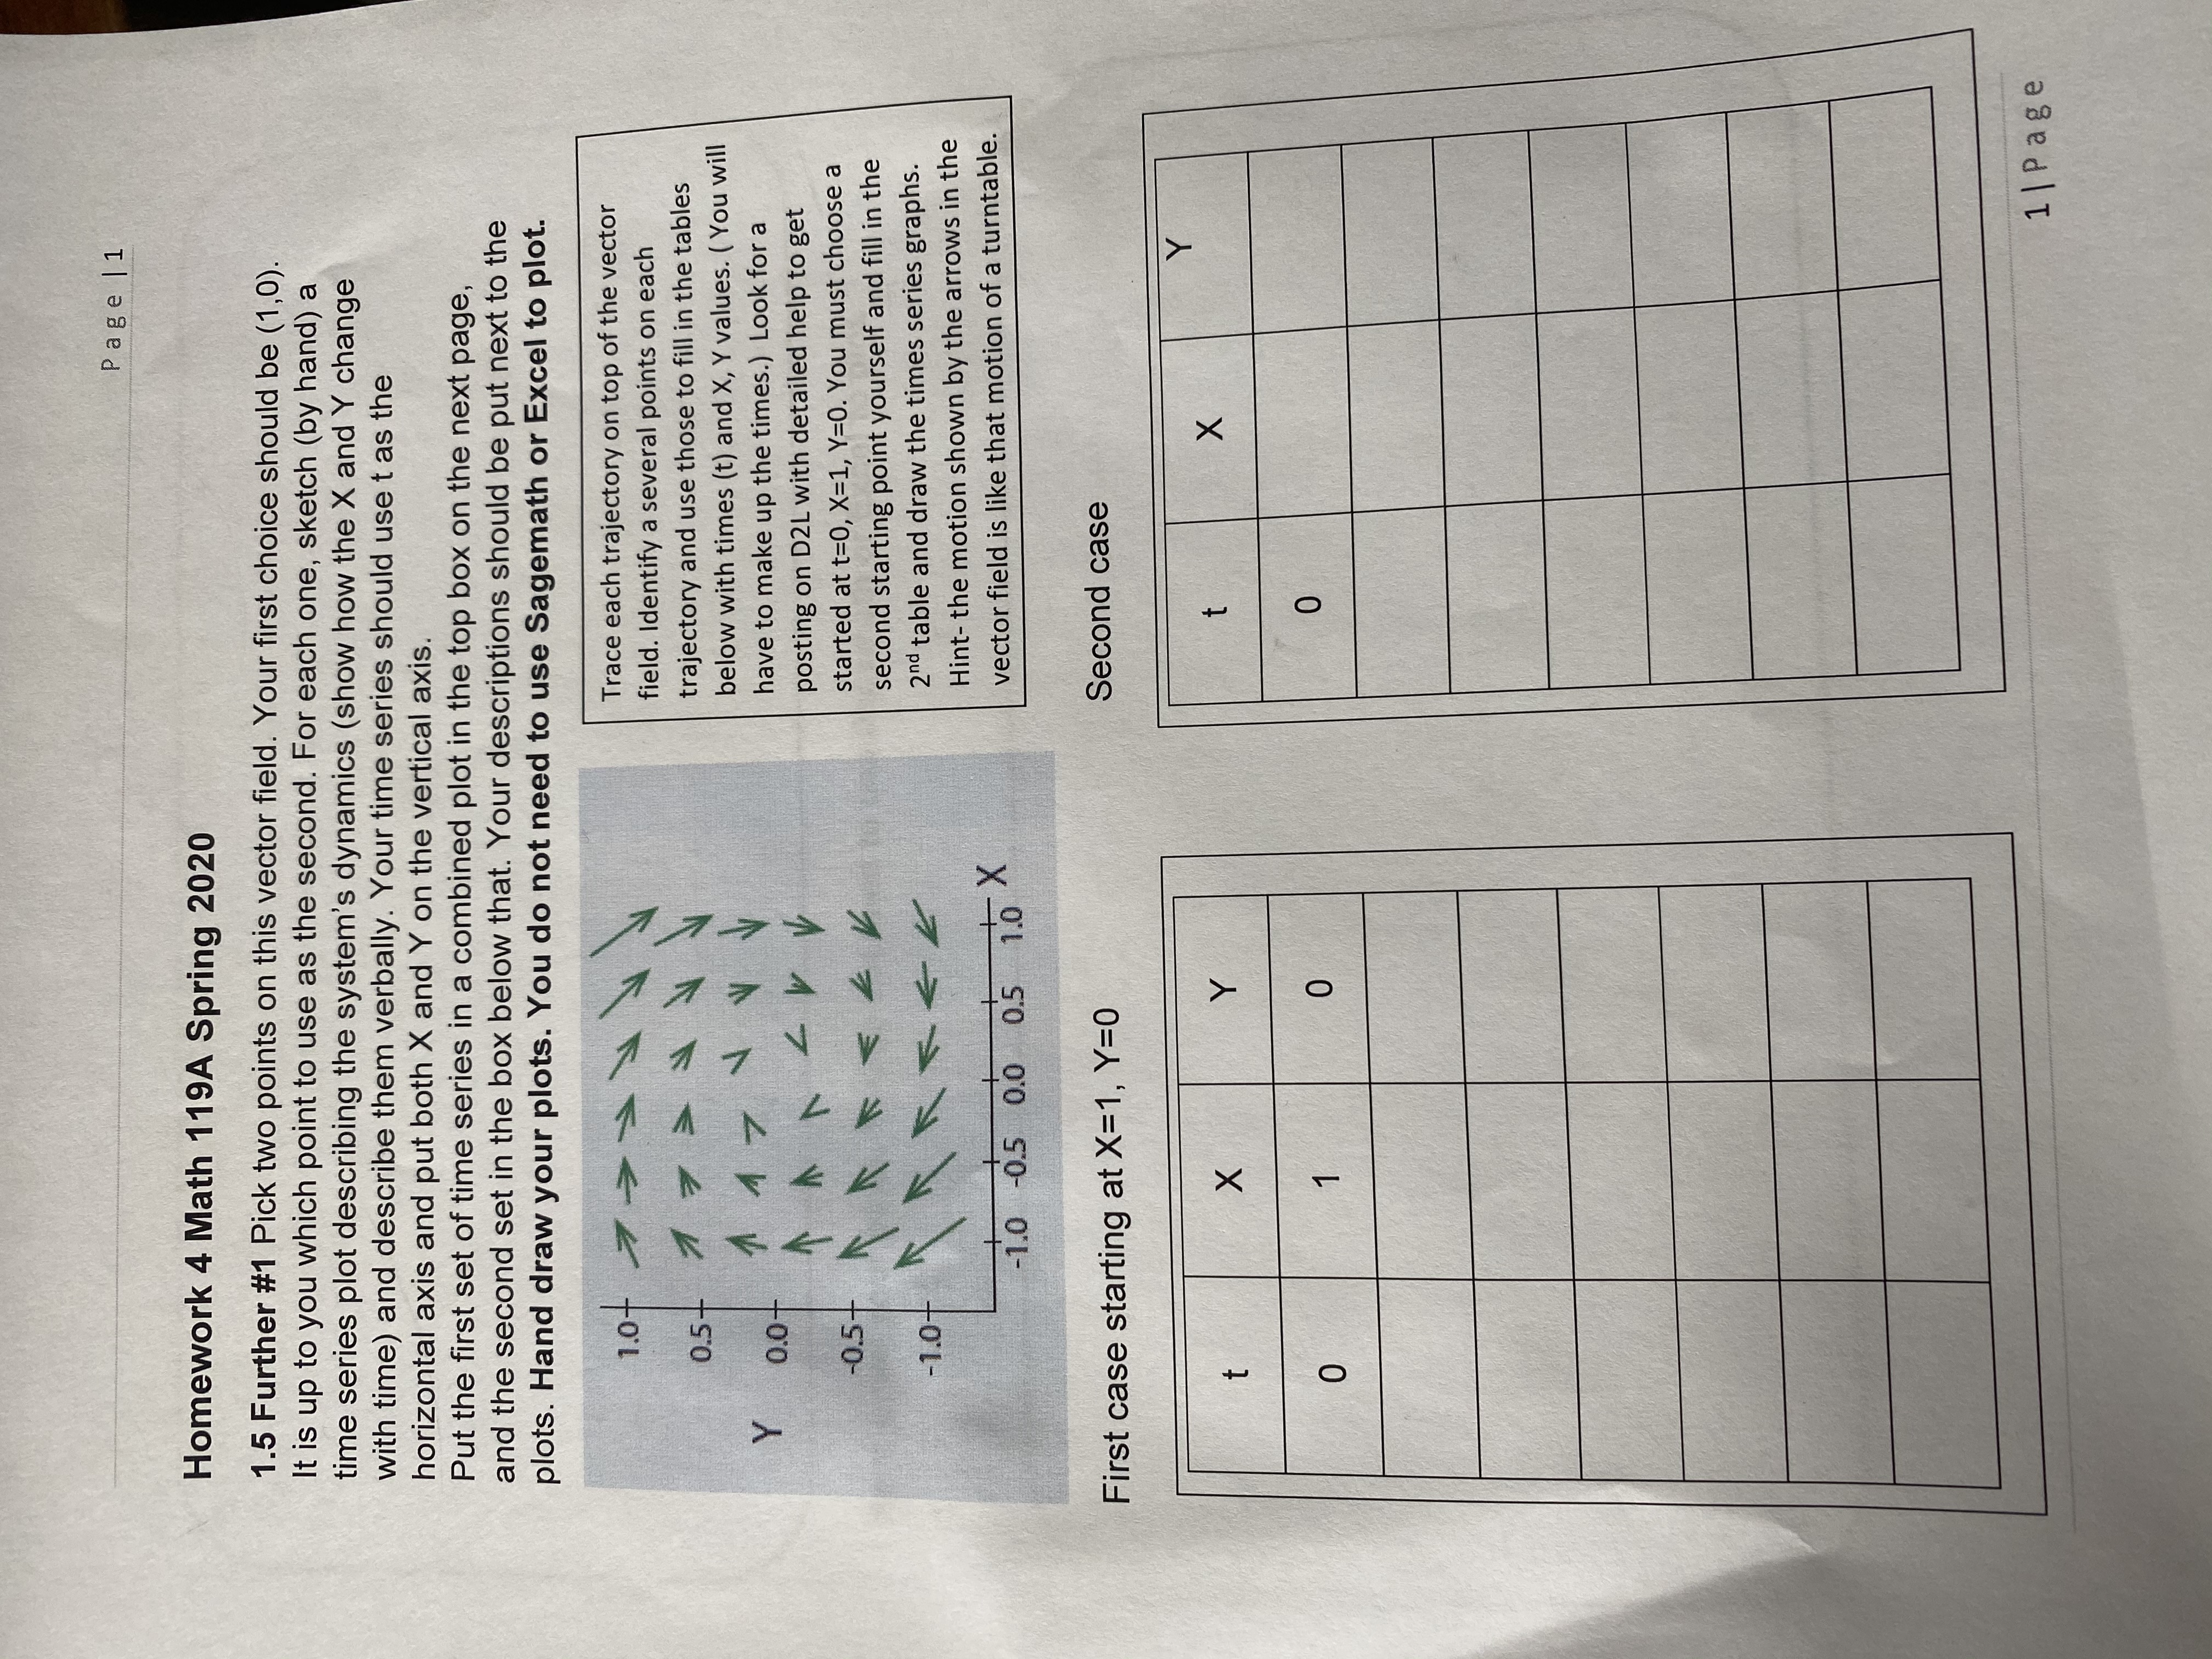
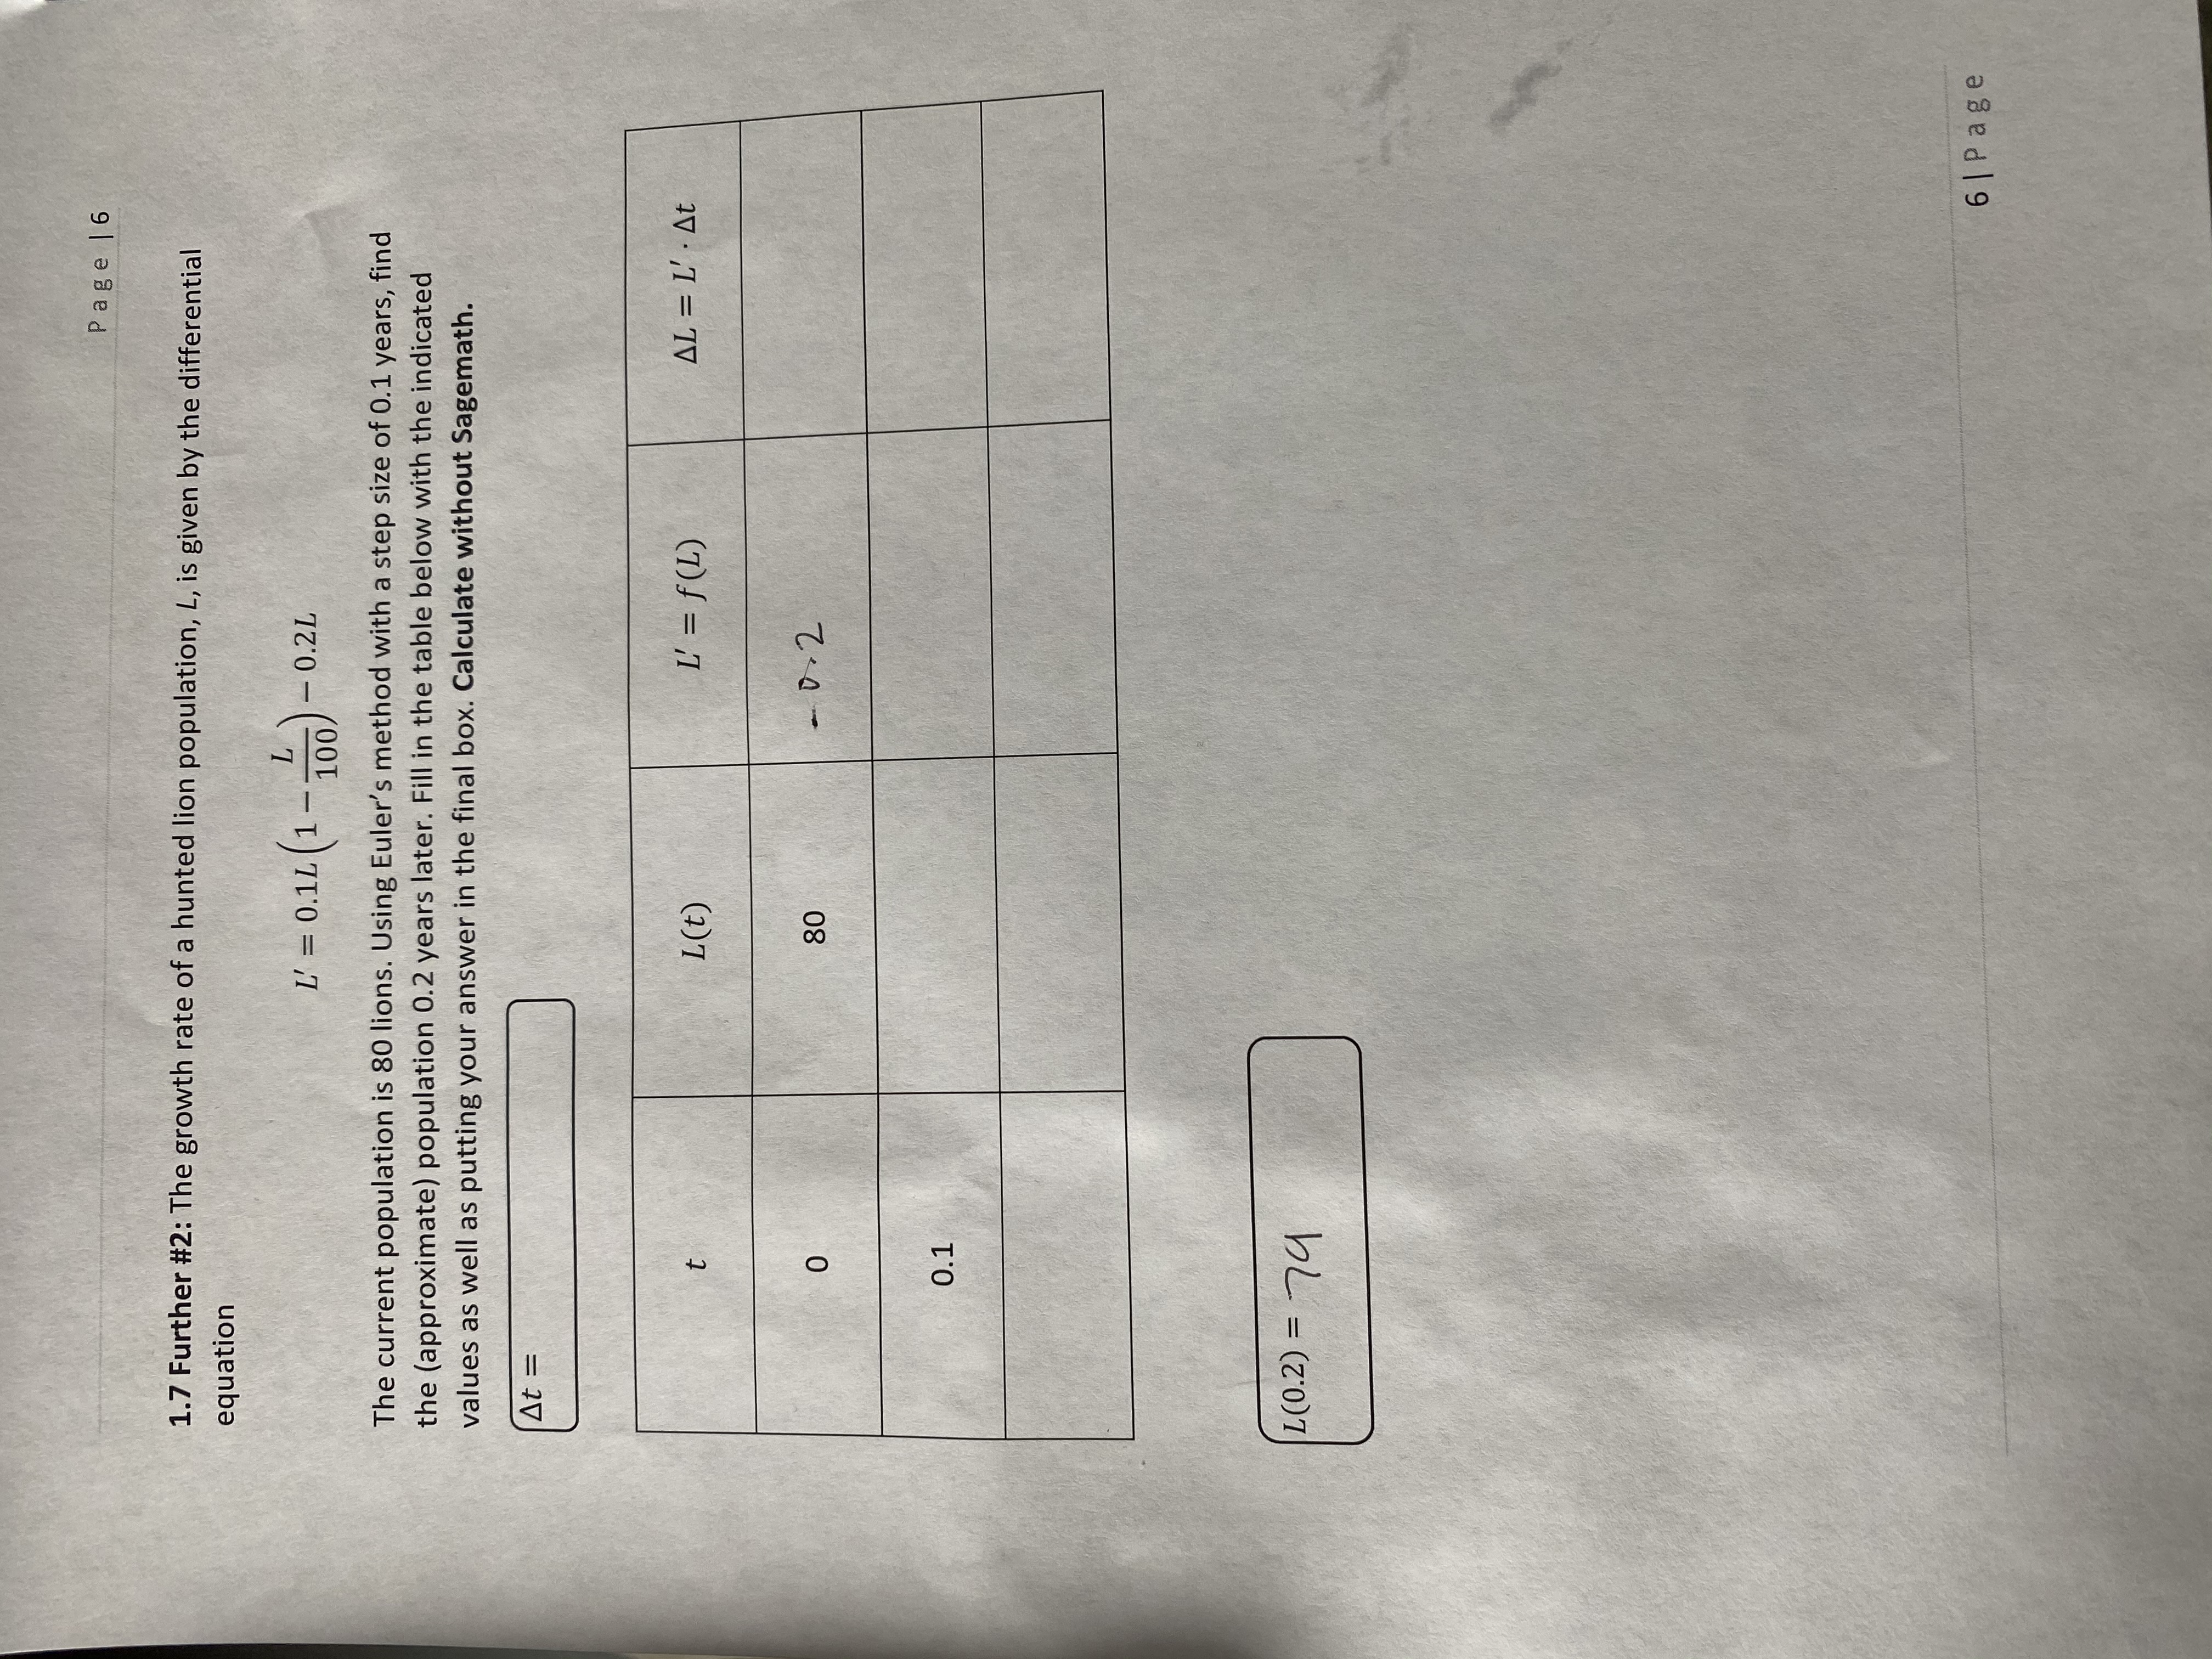
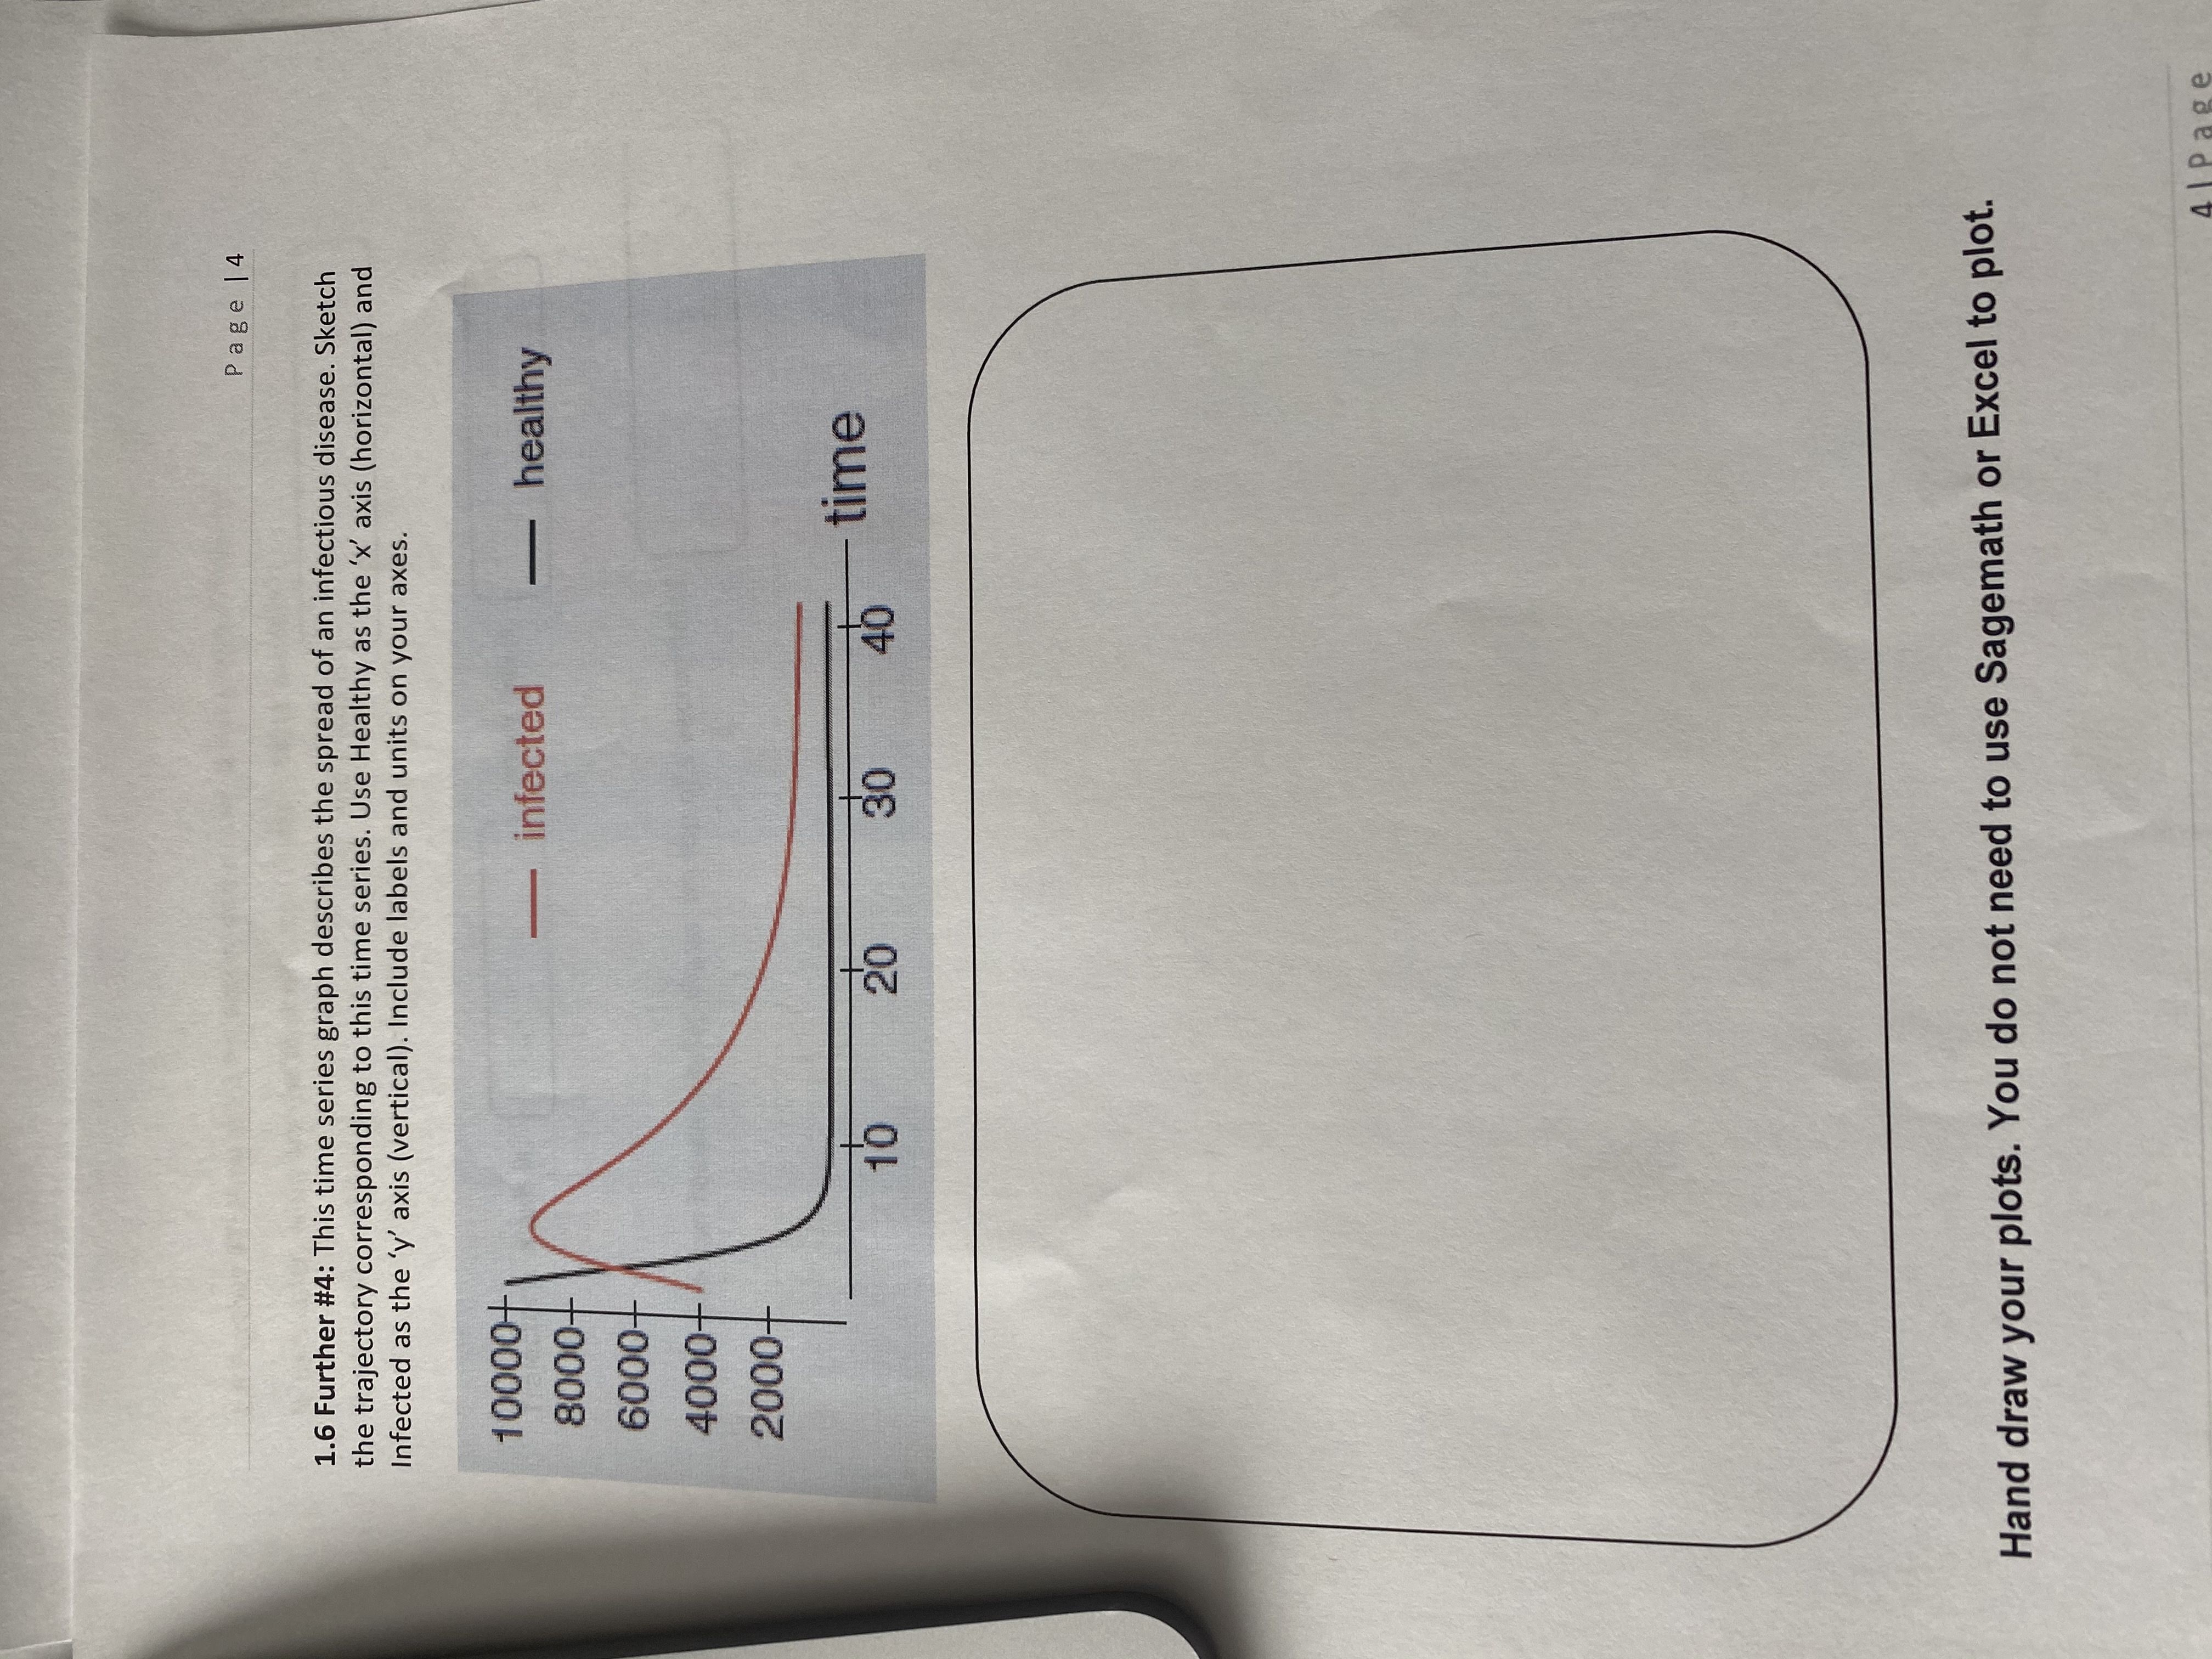
Page |1 Homework 4 Math 119A Spring 2020 1.5 Further #1 Pick two points on this vector field. Your first choice should be (1,0). It is up to you which point to use as the second. For each one, sketch (by hand) a time series plot describing the system's dynamics (show how the X and Y change with time) and describe them verbally. Your time series should use t as the horizontal axis and put both X and Y on the vertical axis. Put the first set of time series in a combined plot in the top box on the next page, and the second set in the box below that. Your descriptions should be put next to the plots. Hand draw your plots. You do not need to use Sagemath or Excel to plot. 1.0+ Trace each trajectory on top of the vector field. Identify a several points on each 0.5 trajectory and use those to fill in the tables Y below with times (t) and X, Y values. ( You will 0.0+ have to make up the times.) Look for a posting on D2L with detailed help to get 0.5+ started at t=0, X=1, Y=0. You must choose a second starting point yourself and fill in the -1.0+ 2nd table and draw the times series graphs. Hint- the motion shown by the arrows in the -1.0 -0.5 0.0 0.5 1.0 X vector field is like that motion of a turntable. First case starting at X=1, Y=0 Second case X Y X 0 0 0 1 |PageHand draw your plots. You do not need to use Sagemath or Excel to plot. 2 |pagePage | 6 1.7 Further #2: The growth rate of a hunted lion population, L, is given by the differential equation L' = 0.1L (1 - 160) -0.2L The current population is 80 lions. Using Euler's method with a step size of 0.1 years, find the (approximate) population 0.2 years later. Fill in the table below with the indicated values as well as putting your answer in the final box. Calculate without Sagemath. At = L(t ) L' = f(L) AL = L' . At 0 80 - 0. 2 0.1 L (0.2) = 79 6 |PagePage |4 1.6 Further #4: This time series graph describes the spread of an infectious disease. Sketch the trajectory corresponding to this time series. Use Healthy as the 'x' axis (horizontal) and Infected as the 'y' axis (vertical). Include labels and units on your axes. 10000+ 8000- infected - healthy 6000+ 4000+ 2000+ 10 20 30 40 time Hand draw your plots. You do not need to use Sagemath or Excel to plot.Page | 6 Page 15 1.6 Further #7: How are a trajectory and a time series graph different? In particular, what are the axes of each? (Time?, State variable?) Time series: x axis is and y axis is Trajectory: x axis is and y axis is Which one can reasonably be drawn on top of a vector field
