

Question
Image 1: image 2: Question: using information in image 1, how to get the result for for a tangency portfolio and MV portfolio showed in
Image 1:
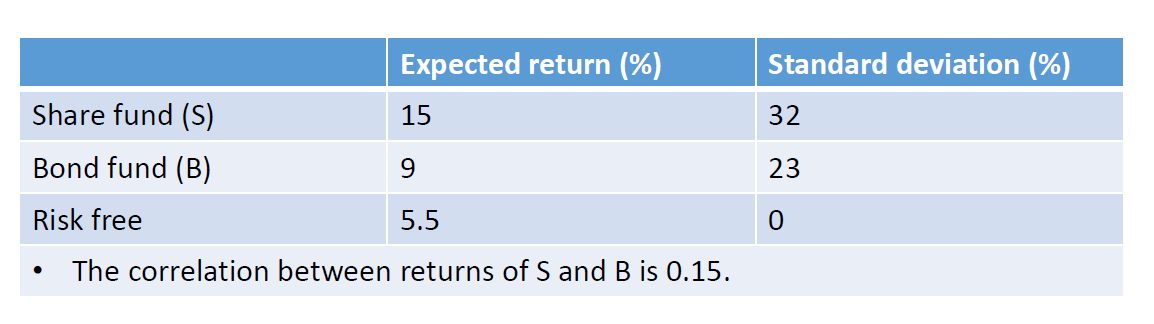
image 2: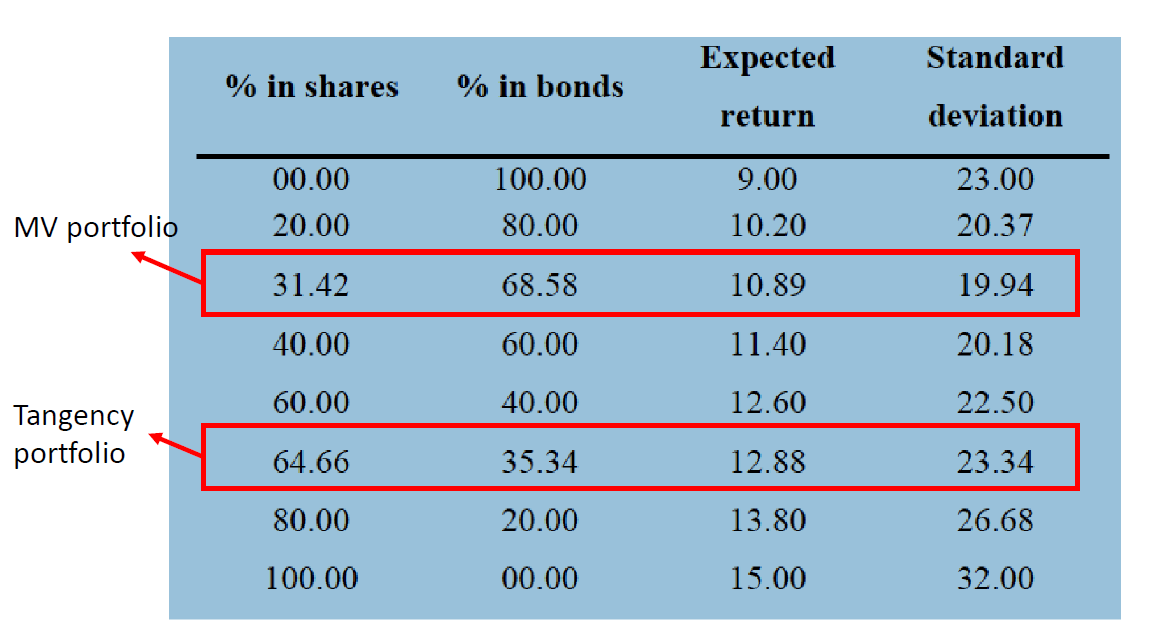
Question: using information in image 1, how to get the result for for a tangency portfolio and MV portfolio showed in image 2? ie, the weights in bond and shares, expected return and standard deviation .
Standard deviation (%) Expected return (%) 15 32 Share fund (S) Bond fund (B) 9 23 Risk free 5.5 0 0 The correlation between returns of S and B is 0.15. Expected Standard % in shares % in bonds return deviation 00.00 20.00 100.00 80.00 9.00 10.20 23.00 20.37 MV portfolio 31.42 68.58 10.89 19.94 40.00 60.00 11.40 20.18 60.00 40.00 12.60 22.50 Tangency portfolio 64.66 35.34 12.88 23.34 80.00 20.00 13.80 26.68 100.00 00.00 15.00 32.00Step by Step Solution
There are 3 Steps involved in it
Step: 1

Get Instant Access to Expert-Tailored Solutions
See step-by-step solutions with expert insights and AI powered tools for academic success
Step: 2

Step: 3
Ace Your Homework with AI
Get the answers you need in no time with our AI-driven, step-by-step assistance
Get Started
Millionaire By Thirty The Quickest Path To Early Financial Independence
Authors: Douglas R. Andrew, Emron Andrew, Aaron Andrew
1st Edition
0446501840, 978-0446501842