

Question
Image caption: The x axis shows the day, ranging from day 1 to day 12. The y axis lists the activities, A through F. For
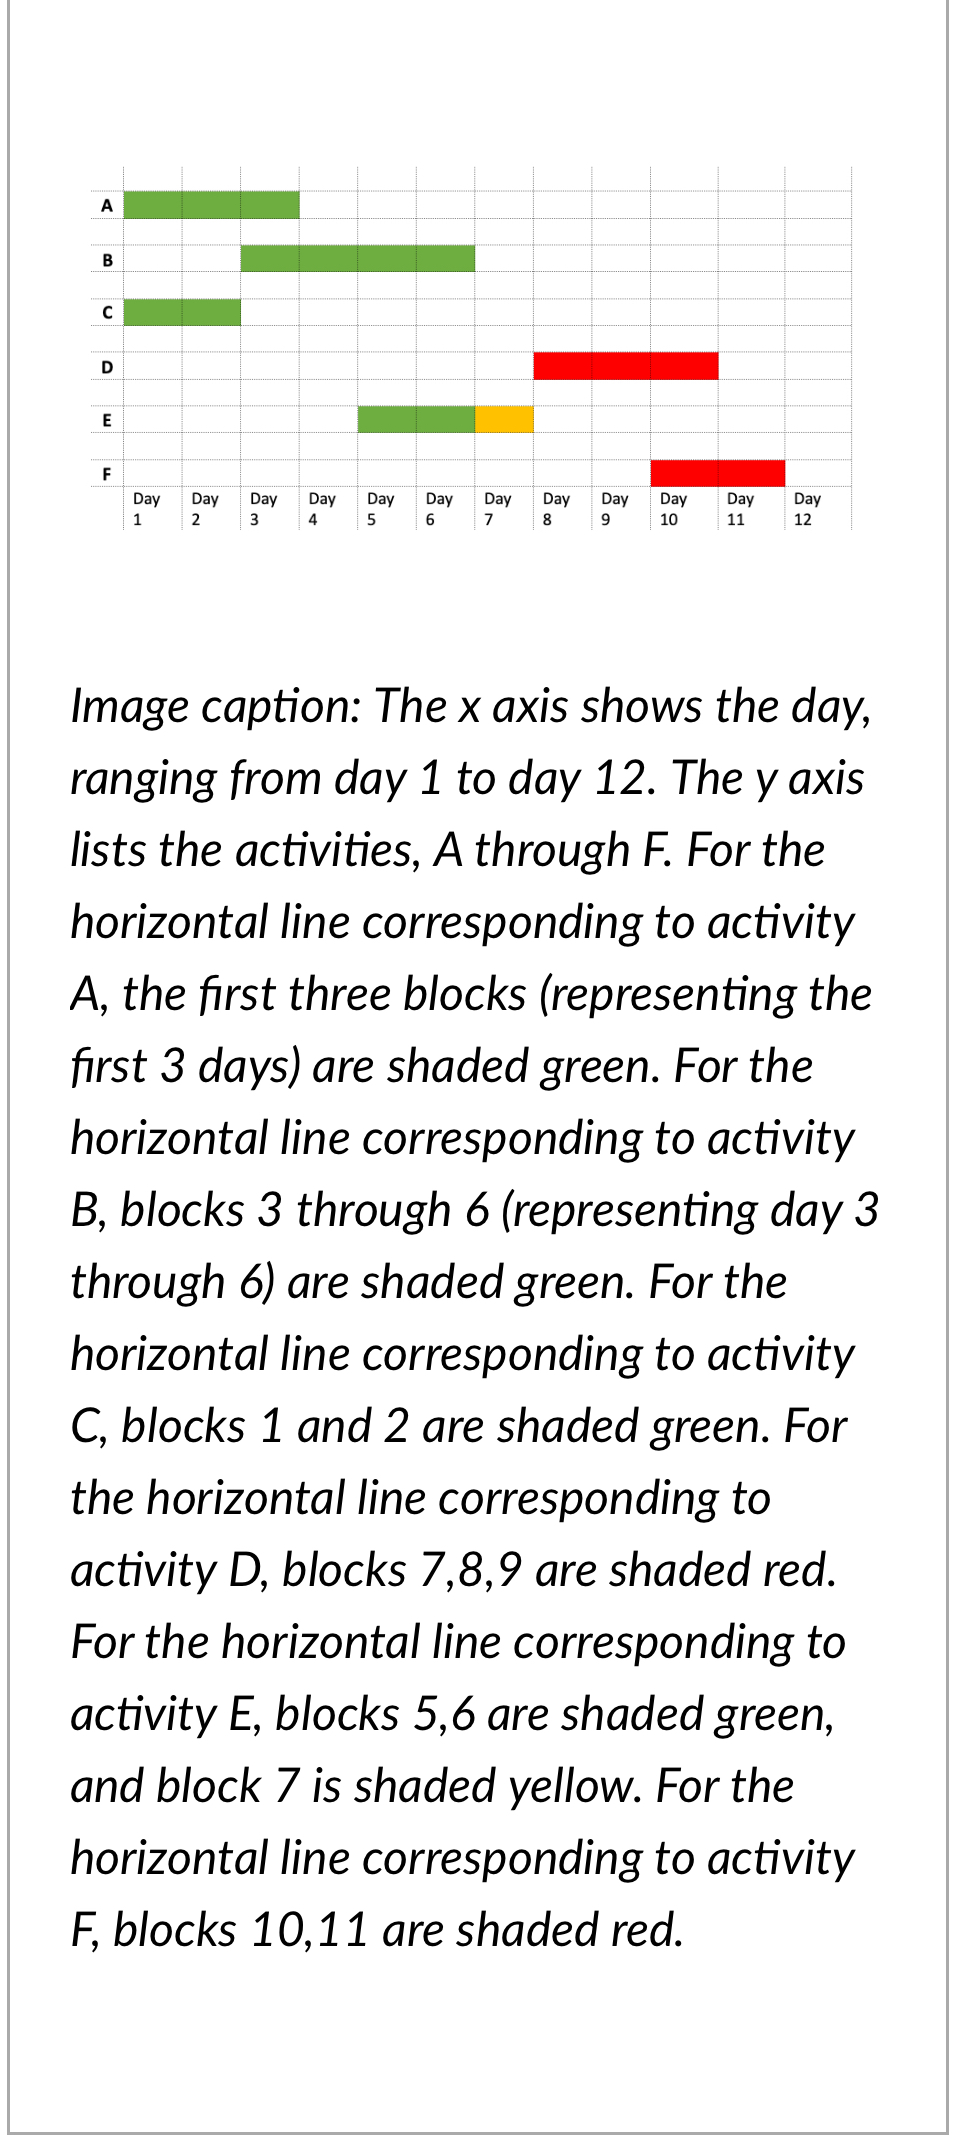
Image caption: The x axis shows the day, ranging from day 1 to day 12. The y axis lists the activities, A through F. For the horizontal line corresponding to activity A, the first three blocks (representing the first 3 days) are shaded green. For the horizontal line corresponding to activity B, blocks 3 through 6 (representing day 3 through 6) are shaded green. For the horizontal line corresponding to activity C, blocks 1 and 2 are shaded green. For the horizontal line corresponding to activity D, blocks 7,8,9 are shaded red. For the horizontal line corresponding to activity E, blocks 5,6 are shaded green, and block 7 is shaded yellow. For the horizontal line corresponding to activity F, blocks 10,11 are shaded red.
What is the cost variance at the end of day 7?
Image caption: The x axis shows the day, ranging from day 1 to day 12 . The y axis lists the activities, A through F. For the horizontal line corresponding to activity A, the first three blocks (representing the first 3 days) are shaded green. For the horizontal line corresponding to activity B, blocks 3 through 6 (representing day 3 through 6) are shaded green. For the horizontal line corresponding to activity C, blocks 1 and 2 are shaded green. For the horizontal line corresponding to activity D, blocks 7,8,9 are shaded red. For the horizontal line corresponding to activity E, blocks 5,6 are shaded green, and block 7 is shaded yellow. For the horizontal line corresponding to activity F, blocks 10,11 are shaded redStep by Step Solution
There are 3 Steps involved in it
Step: 1

Get Instant Access to Expert-Tailored Solutions
See step-by-step solutions with expert insights and AI powered tools for academic success
Step: 2

Step: 3
Ace Your Homework with AI
Get the answers you need in no time with our AI-driven, step-by-step assistance
Get Started
The Productivity Audit
Authors: Mark Spelman, Paul Spence
1st Edition
1907766073, 978-1907766077