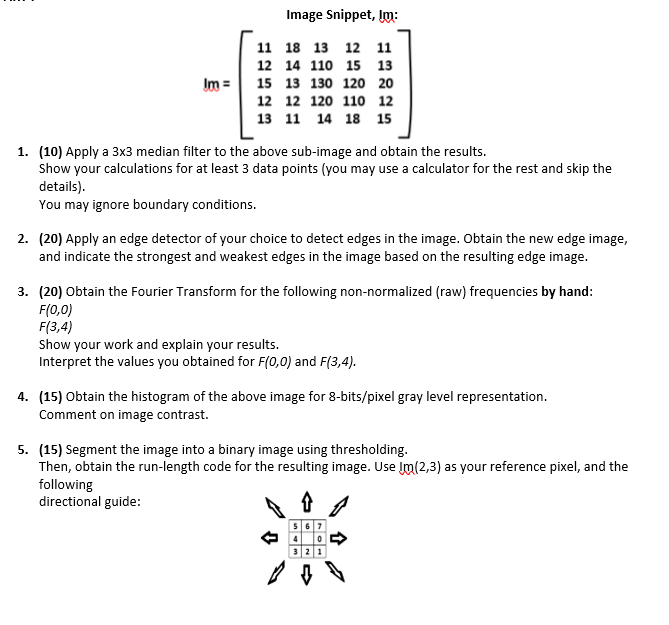
Image Snippet, lm: Im = 11 18 13 12 11 12 14 110 15 13 15 13 130 120 20 12 12 120 110 12 13 11 14 18 15 1. (10) Apply a 3x3 median filter to the above sub-image and obtain the results. Show your calculations for at least 3 data points (you may use a calculator for the rest and skip the details). You may ignore boundary conditions. 2. (20) Apply an edge detector of your choice to detect edges in the image. Obtain the new edge image, and indicate the strongest and weakest edges in the image based on the resulting edge image. 3. (20) Obtain the Fourier Transform for the following non-normalized (raw) frequencies by hand: F(0,0) F(3,4) Show your work and explain your results. Interpret the values you obtained for F(0,0) and F(3,4). 4. (15) Obtain the histogram of the above image for 8-bits/pixel gray level representation. Comment on image contrast. 5. (15) Segment the image into a binary image using thresholding. Then, obtain the run-length code for the resulting image. Use (2,3) as your reference pixel, and the following directional guide: 1 5 6 7 3 2 1 Image Snippet, lm: Im = 11 18 13 12 11 12 14 110 15 13 15 13 130 120 20 12 12 120 110 12 13 11 14 18 15 1. (10) Apply a 3x3 median filter to the above sub-image and obtain the results. Show your calculations for at least 3 data points (you may use a calculator for the rest and skip the details). You may ignore boundary conditions. 2. (20) Apply an edge detector of your choice to detect edges in the image. Obtain the new edge image, and indicate the strongest and weakest edges in the image based on the resulting edge image. 3. (20) Obtain the Fourier Transform for the following non-normalized (raw) frequencies by hand: F(0,0) F(3,4) Show your work and explain your results. Interpret the values you obtained for F(0,0) and F(3,4). 4. (15) Obtain the histogram of the above image for 8-bits/pixel gray level representation. Comment on image contrast. 5. (15) Segment the image into a binary image using thresholding. Then, obtain the run-length code for the resulting image. Use (2,3) as your reference pixel, and the following directional guide: 1 5 6 7 3 2 1


