

Imagine that you are an investor on January 1, 2004, and using the historical data up to that date. Assume that the Global index
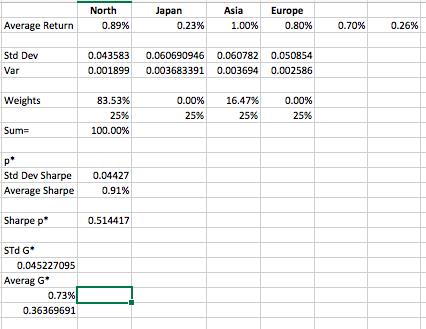
Imagine that you are an investor on January 1, 2004, and using the historical data up to that date. Assume that the Global index cannot be included in your portfolio. a. Plot the efficient frontier for the risky assets assuming that short-selling is allowed. What does the efficient frontier represent? b. What are the weights on the maximum Sharpe Ratio (SR) portfolio assuming short- selling is allowed? If you applied these weights to your portfolio on January 1, 2004, what would the SR of your portfolio be over the next 10 years (out-of-sample test)? c. What are the weights on the maximum SR portfolio assuming short-selling is NOT allowed? If you applied these weights to your portfolio, what would the SR of your portfolio be over the next 10 years? d. Comparing the performance of the two approaches in (b) and (c), which one generated better out-of-sample performance? Explain. e. What are the weights on the minimum global variance portfolio? If you applied these weights to your portfolio, what would the SR of your portfolio be over the next 10 years? North Average Return 0.89% Std Dev Var Weights Sum= p* Std Dev Sharpe Average Sharpe Sharpe p STd G* 0.045227095 Averag G* 0.73% 0.36369691 0.043583 0.001899 83.53% 25% 100.00% 0.04427 0.91% 0.514417 Japan 0.23% Asia 0.00% 25% 1.00% Europe 0.060690946 0.060782 0.050854 0.003683391 0.003694 0.002586 16.47% 25% 0.80% 0.00% 25% 0.70% 0.26%
Step by Step Solution
3.59 Rating (167 Votes )
There are 3 Steps involved in it
Step: 1
a The efficient frontier is the set of portfolios that offers the highest expected return for a give... View full answer

Get step-by-step solutions from verified subject matter experts
100% Satisfaction Guaranteed-or Get a Refund!
Step: 2Unlock detailed examples and clear explanations to master concepts

Step: 3Unlock to practice, ask and learn with real-world examples
See step-by-step solutions with expert insights and AI powered tools for academic success
-
 Access 30 Million+ textbook solutions.
-
Ask unlimited questions from AI Tutors.
-
Order free textbooks.
-
100% Satisfaction Guaranteed-or Get a Refund!
Claim Your Hoodie Now!
Authors: Charles T. Horngren, Srikant M.Dater, George Foster, Madhav
13th Edition
8120335643, 136126634, 978-0136126638

Study Smart with AI Flashcards
Access a vast library of flashcards, create your own, and experience a game-changing transformation in how you learn and retain knowledge
Explore Flashcards

