

Answered step by step
Verified Expert Solution
Question
1 Approved Answer
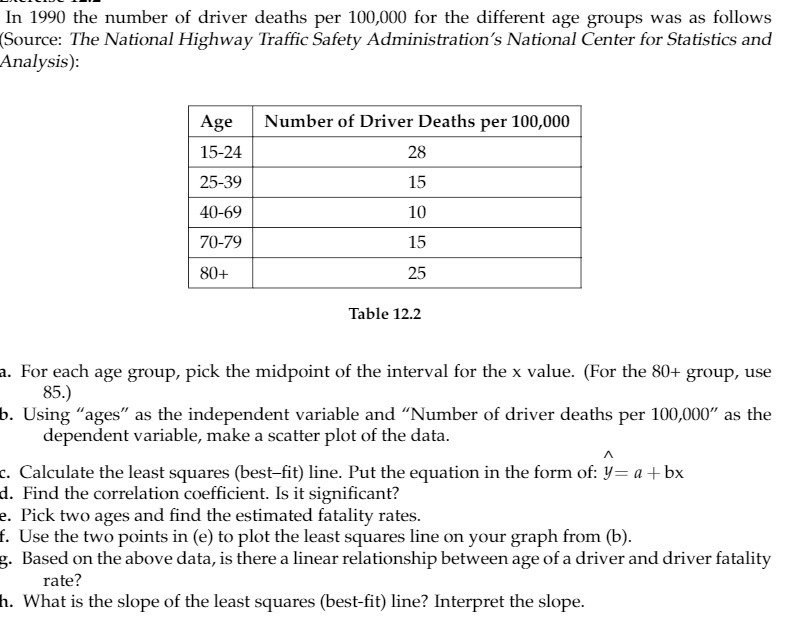
In 1990 the number of driver deaths per 100 000 for the different age groups was as follows ( Source : The National Highway Traffic
Step by Step Solution
There are 3 Steps involved in it
Step: 1

Get Instant Access to Expert-Tailored Solutions
See step-by-step solutions with expert insights and AI powered tools for academic success
Step: 2

Step: 3
Ace Your Homework with AI
Get the answers you need in no time with our AI-driven, step-by-step assistance
Get Started
Elementary Statisitcs
Authors: Barry Monk
2nd edition
1259345297, 978-0077836351, 77836359, 978-1259295911, 1259295915, 978-1259292484, 1259292487, 978-1259345296