In 202202_MTH_101_001: MyLab St X Do Homework - Homework (Sect X + X > C A mathxl.com/Student/PlayerHomework.aspx?homeworkld=612621075&questionld=25&flushed=false&cld=6713727&back=https://www.mathxl.com/Student/DoA... it Apps @ YouTube M Gmail . Maps
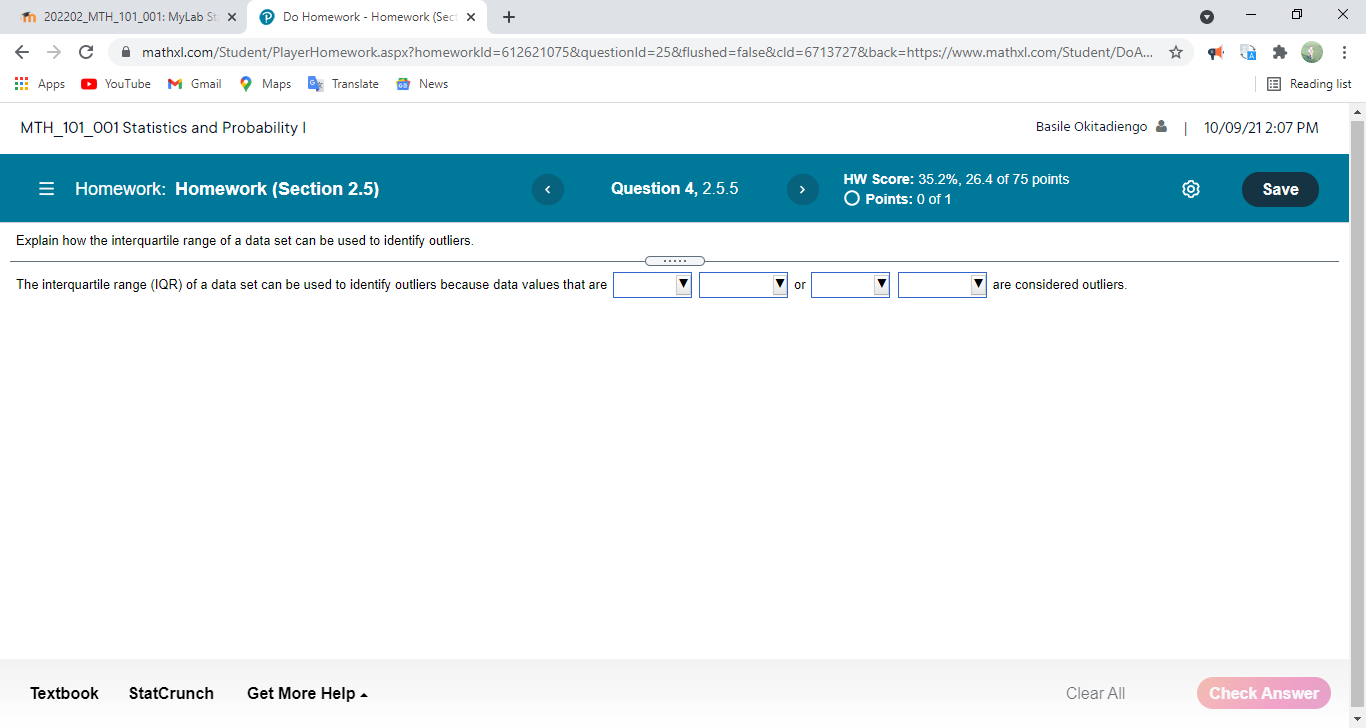
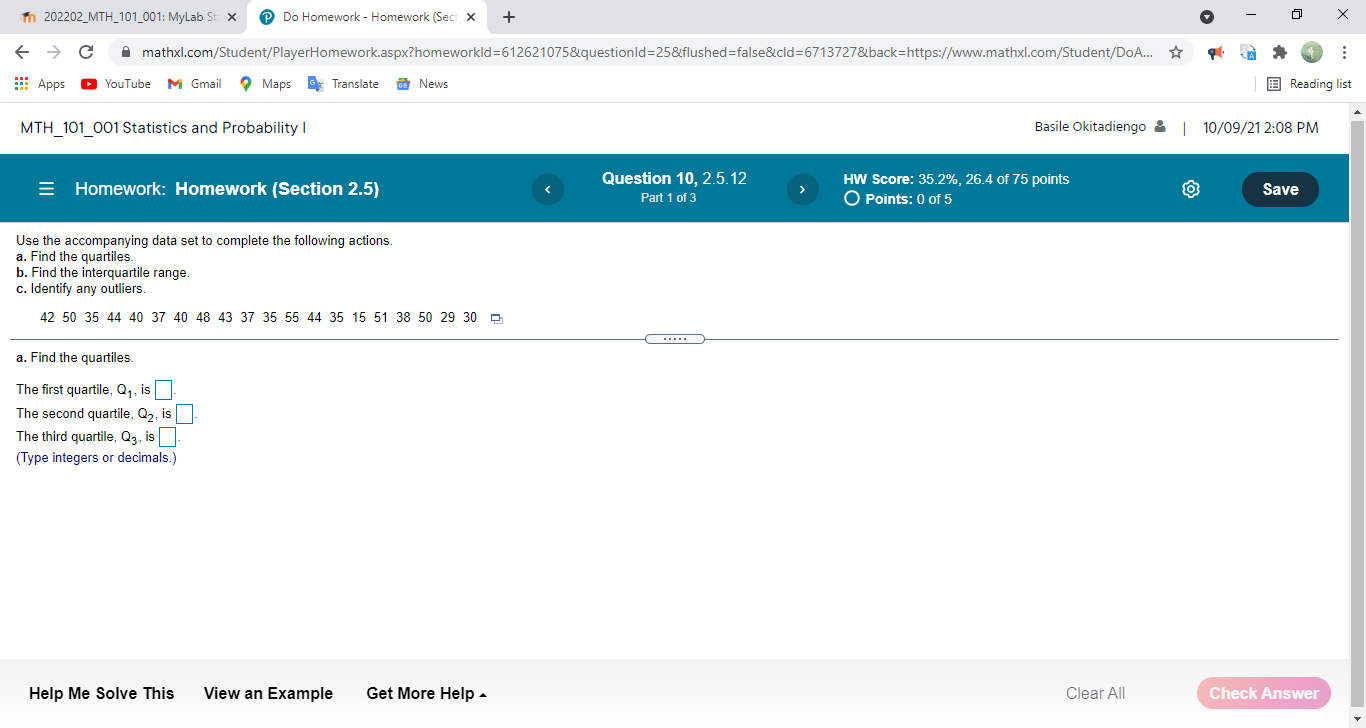
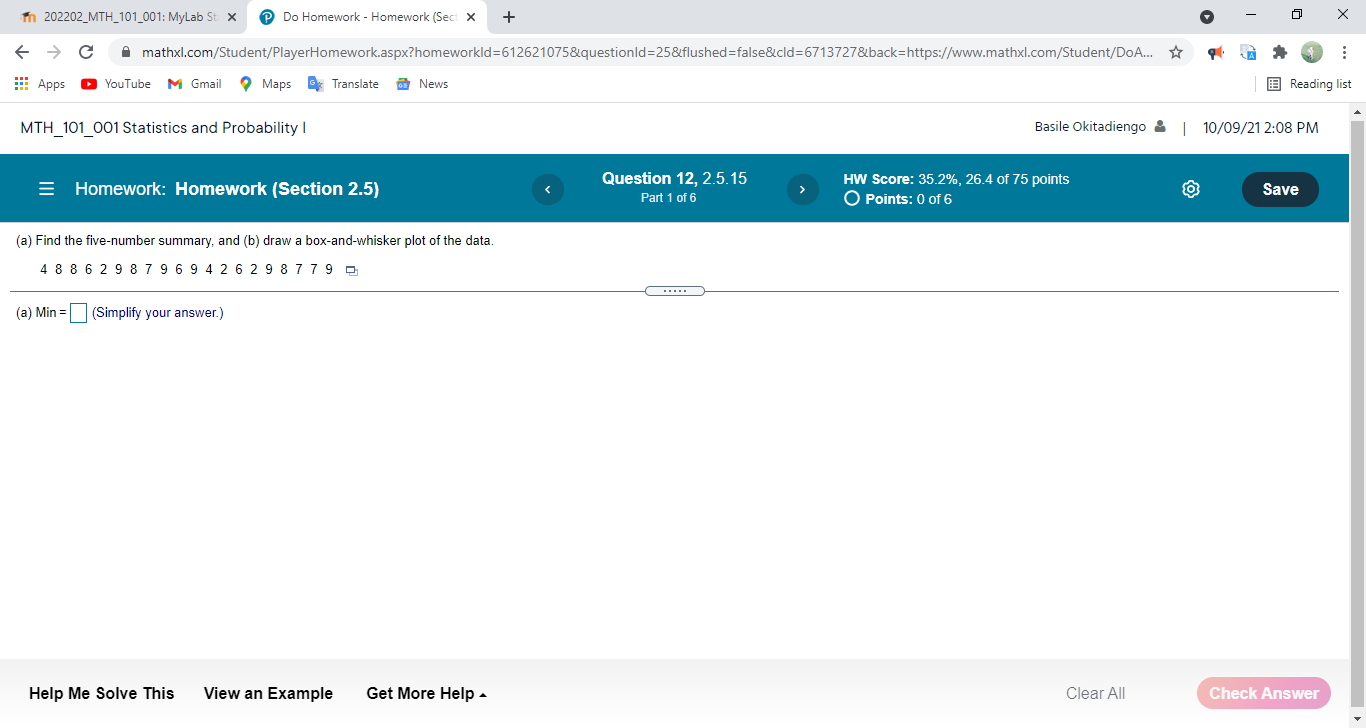
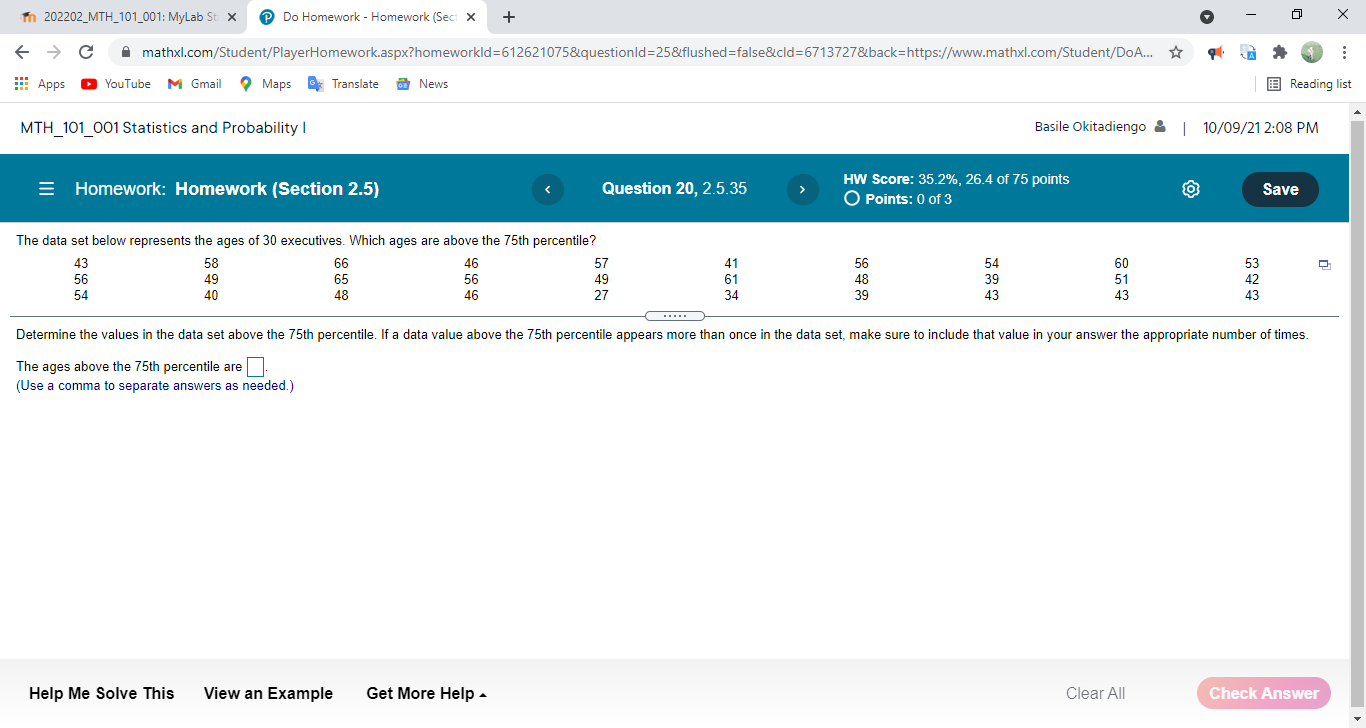
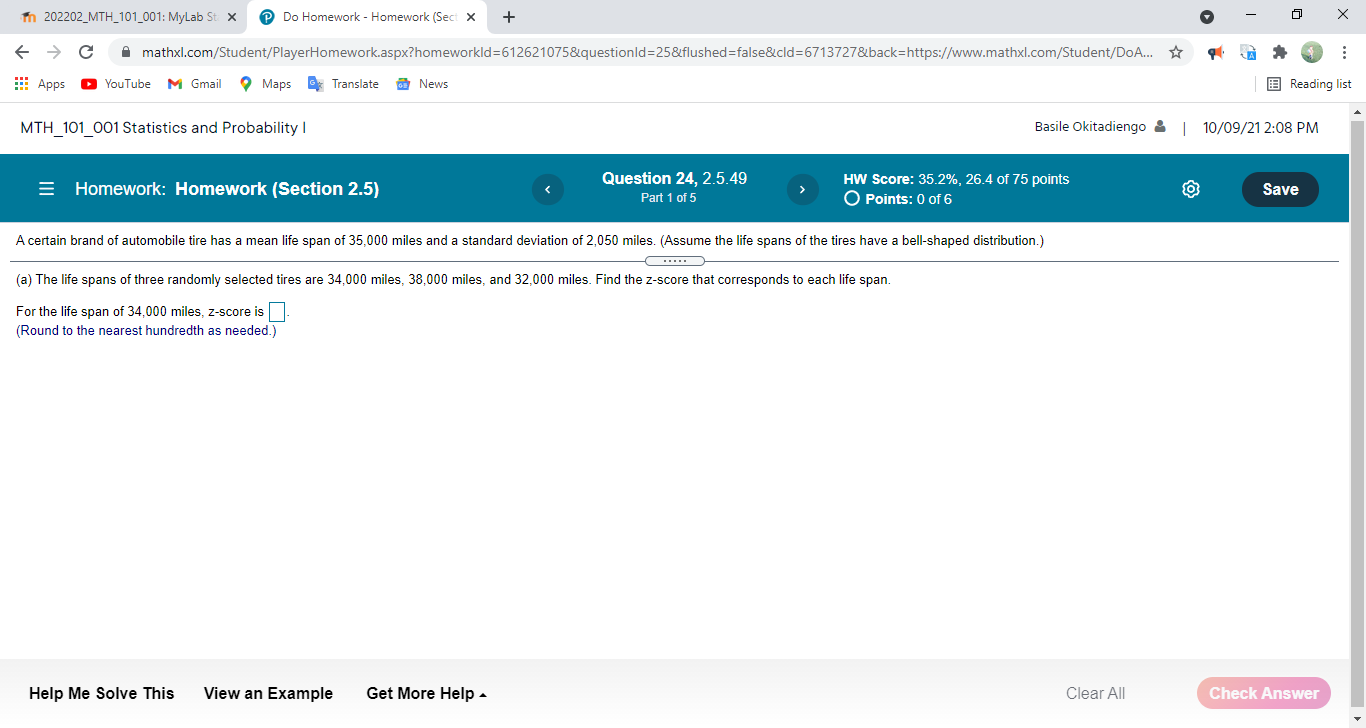
In 202202_MTH_101_001: MyLab St X Do Homework - Homework (Sect X + X > C A mathxl.com/Student/PlayerHomework.aspx?homeworkld=612621075&questionld=25&flushed=false&cld=6713727&back=https://www.mathxl.com/Student/DoA... it Apps @ YouTube M Gmail . Maps Translate News Reading list MTH_101_001 Statistics and Probability I Basile Okitadiengo & | 10/09/212:07 PM = Homework: Homework (Section 2.5) Question 4, 2.5.5 HW Score: 35.2%, 26.4 of 75 points Save O Points: 0 of 1 Explain how the interquartile range of a data set can be used to identify outliers. . . . . . The interquartile range (IQR) of a data set can be used to identify outliers because data values that are are considered outliers. Textbook StatCrunch Get More Help - Clear All Check AnswerIn 202202_MTH_101_001: MyLab St X Do Homework - Homework (Sect X + X > C A mathxl.com/Student/PlayerHomework.aspx?homeworkld=612621075&questionld=25&flushed=false&cld=6713727&back=https://www.mathxl.com/Student/DoA... it Apps @ YouTube M Gmail . Maps Translate @ News Reading list MTH_101_001 Statistics and Probability I Basile Okitadiengo & | 10/09/21 2:08 PM = Homework: Homework (Section 2.5) Question 10, 2.5.12 HW Score: 35.2%, 26.4 of 75 points Part 1 of 3 O Points: 0 of 5 Save Use the accompanying data set to complete the following actions. a. Find the quartiles. b. Find the interquartile range. c. Identify any outliers. 42 50 35 44 40 37 40 48 43 37 35 55 44 35 15 51 38 50 29 30 . . . . . a. Find the quartiles. The first quartile, Q1, is The second quartile, Q2, is The third quartile, Q3, is (Type integers or decimals.) Help Me Solve This View an Example Get More Help - Clear All Check AnswerIn 202202_MTH_101_001: MyLab St X Do Homework - Homework (Sect X + X > C A mathxl.com/Student/PlayerHomework.aspx?homeworkld=612621075&questionld=25&flushed=false&cld=6713727&back=https://www.mathxl.com/Student/DoA... it Apps @ YouTube M Gmail . Maps Translate News Reading list MTH_101_001 Statistics and Probability I Basile Okitadiengo & | 10/09/21 2:08 PM = Homework: Homework (Section 2.5) Question 12, 2.5.15 HW Score: 35.2%, 26.4 of 75 points Part 1 of 6 O Points: 0 of 6 Save (a) Find the five-number summary, and (b) draw a box-and-whisker plot of the data. 4 8 8 6 2 9 8 7 9 6 9 4 2 6 2 9 8 7 79 5 (a) Min = (Simplify your answer.) Help Me Solve This View an Example Get More Help - Clear All Check AnswerX In 202202_MTH_101_001: MyLab St X Do Homework - Homework (Sect X + > C A mathxl.com/Student/PlayerHomework.aspx?homeworkld=612621075&questionld=25&flushed=false&cld=6713727&back=https://www.mathxl.com/Student/DoA... Reading list it Apps @ YouTube M Gmail . Maps Translate News Basile Okitadiengo & | 10/09/21 2:08 PM MTH_101_001 Statistics and Probability I HW Score: 35.2%, 26.4 of 75 points Question 20, 2.5.35 Save = Homework: Homework (Section 2.5) O Points: 0 of 3 The data set below represents the ages of 30 executives. Which ages are above the 75th percentile? 43 58 99 46 57 41 56 54 60 53 48 39 51 56 49 65 56 49 61 48 46 27 34 39 43 43 43 54 40 Determine the values in the data set above the 75th percentile. If a data value above the 75th percentile appears more than once in the data set, make sure to include that value in your answer the appropriate number of times. The ages above the 75th percentile are]. (Use a comma to separate answers as needed.) Check Answer Help Me Solve This View an Example Get More Help - Clear AllIn 202202_MTH_101_001: MyLab St X Do Homework - Homework (Sect X + X > C A mathxl.com/Student/PlayerHomework.aspx?homeworkld=612621075&questionld=25&flushed=false&cld=6713727&back=https://www.mathxl.com/Student/DoA... it Apps @ YouTube M Gmail . Maps Translate @ News Reading list MTH_101_001 Statistics and Probability I Basile Okitadiengo & | 10/09/21 2:08 PM = Homework: Homework (Section 2.5) Question 24, 2.5.49 HW Score: 35.2%, 26.4 of 75 points Part 1 of 5 O Points: 0 of 6 Save A certain brand of automobile tire has a mean life span of 35,000 miles and a standard deviation of 2,050 miles. (Assume the life spans of the tires have a bell-shaped distribution.) (a) The life spans of three randomly selected tires are 34,000 miles, 38,000 miles, and 32,000 miles. Find the z-score that corresponds to each life span. For the life span of 34,000 miles, z-score is (Round to the nearest hundredth as needed.) Help Me Solve This View an Example Get More Help - Clear All Check
Step by Step Solution
There are 3 Steps involved in it
Step: 1
Get Instant Access to Expert-Tailored Solutions
See step-by-step solutions with expert insights and AI powered tools for academic success
Step: 2
Step: 3
Ace Your Homework with AI
Get the answers you need in no time with our AI-driven, step-by-step assistance