

Answered step by step
Verified Expert Solution
Question
1 Approved Answer
Please show all formulas in excel Flavors Spreadsheet Flavor #Pints Containers Sold Current Qtr #Gallons Containers Sold Current Qtr #Tubs Used Current Qtr Vanilla 147,829
Please show all formulas in excel 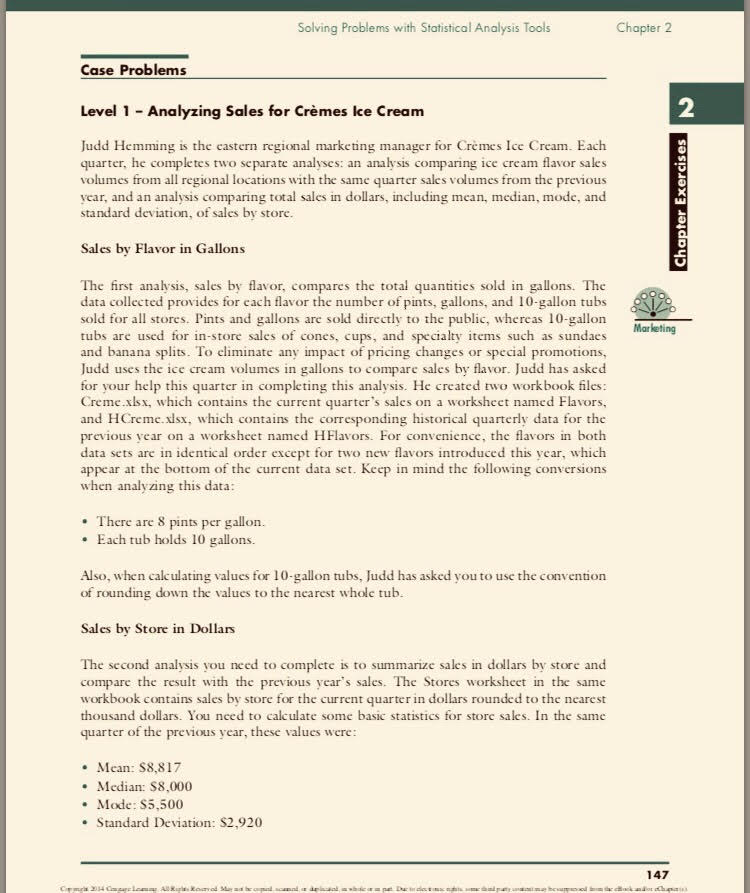
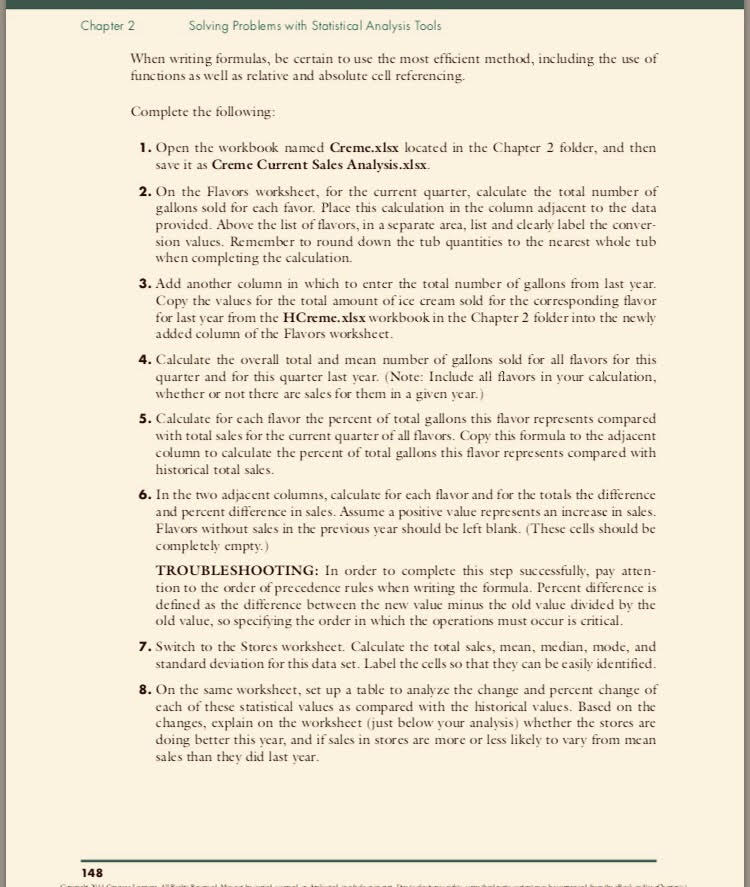
Flavors Spreadsheet
| Flavor | #Pints Containers Sold Current Qtr | #Gallons Containers Sold Current Qtr | #Tubs Used Current Qtr |
| Vanilla | 147,829 | 6,927 | 1,148.15 |
| Chocolate | 215,191 | 17,104 | 5,895.33 |
| Strawberry | 30,253 | 3,231 | 1,887.84 |
| Maple Walnut | 51,762 | 2,489 | 535.01 |
| Praline | 68,612 | 2,532 | 819.58 |
| Butter Pecan | 34,525 | 2,571 | 132.63 |
| Chocolate Chip | 89,193 | 4,222 | 1,782.90 |
| Mint Chocolate Chip | 100,305 | 1,229 | 354.01 |
| Cookie Dough | 82,110 | 2,736 | 1,023.65 |
| Rocky Road | 41,568 | 3,430 | 979.84 |
| Fudge Swirl | 57,171 | 2,800 | 1,357.90 |
| Peach | 59,227 | 1,423 | 1,110.52 |
| Pumpkin | - | - | - |
| Marshmallow Fudge | 7,620 | 650 | 268.37 |
| Coffee | 228,592 | 5,547 | 2,081.75 |
| Mocha Chip | 117,849 | 4,742 | 185.74 |
| Raspberry | - | - | - |
| Watermelon | 54,154 | 2,423 | 1,478.99 |
| Cinnamon Spice | - | - | - |
| Chocolate Fudge | 52,747 | 3,083 | 158.11 |
| Cherry Vanilla | 69,125 | 3,536 | 1,437.34 |
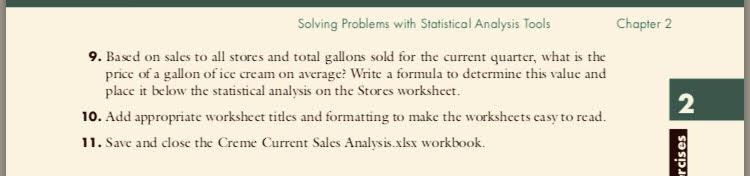
Stores Spreadsheet
| Store# | Sales |
| 101 | 2,559 |
| 102 | 9,439 |
| 103 | 8,829 |
| 104 | 13,440 |
| 105 | 1,624 |
| 106 | 1,686 |
| 107 | 12,296 |
| 108 | 18,041 |
| 109 | 5,291 |
| 110 | 12,646 |
| 111 | 14,399 |
| 112 | 11,221 |
| 113 | 8,740 |
| 114 | 12,200 |
| 115 | 18,444 |
| 116 | 17,578 |
| 117 | 1,393 |
| 118 | 7,933 |
| 119 | 9,347 |
| 120 | 1,644 |
| 121 | 607 |
| 122 | 15,000 |
| 123 | 16,260 |
| 124 | 1,912 |
| 125 | 14,840 |
| 126 | 12,273 |
| 127 | 1,363 |
| 128 | 2,511 |
| 129 | 4,866 |
| 130 | 5,733 |
| 131 | 4,643 |
| 132 | 6,758 |
| 133 | 5,761 |
| 134 | 12,754 |
| 135 | 6,978 |
| 136 | 10,603 |
| 137 | 15,278 |
| 138 | 5,918 |
| 139 | 3,475 |
| 140 | 16,061 |
| 141 | 13,633 |
| 142 | 5,750 |
| 143 | 10,693 |
| 144 | 13,421 |
| 145 | 2,216 |
| 146 | 5,913 |
| 147 | 16,567 |
| 148 | 9,486 |
| 149 | 8,146 |
| 150 | 12,380 |
| 151 | 7,197 |
| 152 | 17,090 |
| 153 | 1,347 |
| 154 | 5,997 |
| 155 | 15,750 |
| 156 | 6,425 |
| 157 | 4,734 |
| 158 | 11,067 |
| 159 | 15,513 |
| 160 | 3,320 |
| 161 | 14,248 |
| 162 | 3,131 |
| 163 | 931 |
| 164 | 14,497 |
| 165 | 12,605 |
| 166 | 4,578 |
| 167 | 5,192 |
| 168 | 10,127 |
| 169 | 15,405 |
| 170 | 2,509 |
| 171 | 14,243 |
| 172 | 15,951 |
| 173 | 2,898 |
| 174 | 11,366 |
| 175 | 8,152 |
| 176 | 3,928 |
| 177 | 19,340 |
| 178 | 9,673 |
| 179 | 19,088 |
| 180 | 7,556 |
| 181 | 17,311 |
| 182 | 15,331 |
| 183 | 12,061 |
| 184 | 17,106 |
| 185 | 9,170 |
| 186 | 6,539 |
| 187 | 14,784 |
| 188 | 8,991 |
| 189 | 1,353 |
| 190 | 7,795 |
| 191 | - |
| 192 | 13,857 |
| 193 | 11,129 |
| 194 | 14,897 |
| 195 | 10,308 |
| 196 | 9,037 |
| 197 | 18,210 |
| 198 | 20,503 |
| 199 | 13,689 |
| 200 | 5,456 |
| 201 | 11,350 |
| 202 | 10,000 |
| 203 | 6,153 |
| 204 | 15,577 |
| 205 | 7,636 |
| 206 | 4,648 |
| 207 | 1,216 |
| 208 | 8,419 |
| 209 | 9,755 |
| 210 | 2,478 |
| 211 | 14,092 |
| 212 | 8,326 |
| 213 | 8,821 |
| 214 | 1,362 |
| 215 | 4,779 |
| 216 | 10,073 |
| 217 | 12,956 |
| 218 | 13,721 |
| 219 | 11,264 |
| 220 | 15,370 |
| 221 | 12,920 |
| 222 | 14,555 |
| 223 | 15,748 |
| 224 | 18,827 |
| 225 | 6,865 |
| 226 | 3,528 |
| 227 | 8,410 |
| 228 | 16,427 |
| 229 | 852 |
| 230 | 2,326 |
| 231 | 11,893 |
| 232 | 261 |
| 233 | 16,355 |
| 234 | 12,345 |
| 235 | 13,690 |
| 236 | 15,876 |
| 237 | 9,083 |
| 238 | 3,079 |
| 239 | 6,091 |
| 240 | 3,644 |
| 241 | 1,035 |
| 242 | 2,343 |
| 243 | 11,346 |
| 244 | 3,573 |
| 245 | 6,351 |
| 246 | 12,052 |
| 247 | 7,659 |
| 248 | 16,054 |
| 249 | 4,476 |
| 250 | 7,953 |
| 251 | 7,568 |
| 252 | 10,006 |
| 253 | 6,886 |
| 254 | 7,862 |
| 255 | 1,438 |
| 256 | 4,054 |
| 257 | 10,662 |
| 258 | 8,683 |
| 259 | 13,904 |
| 260 | 11,232 |
| 261 | 12,709 |
| 262 | 3,301 |
| 263 | 5,956 |
| 264 | 3,415 |
| 265 | 8,810 |
| 266 | 9,361 |
| 267 | 11,871 |
| 268 | 7,574 |
| 269 | 12,939 |
| 270 | 9,425 |
| 271 | 7,127 |
| 272 | 2,125 |
| 273 | 10,927 |
| 274 | 19,181 |
| 275 | 15,955 |
| 276 | 1,661 |
| 277 | 1,131 |
| 278 | 1,226 |
| 279 | 4,853 |
| 280 | 12,355 |
| 281 | 6,454 |
| 282 | 14,284 |
| 283 | 1,856 |
| 284 | 1,371 |
| 285 | 14,971 |
| 286 | 11,443 |
| 287 | 9,361 |
| 288 | 3,581 |
| 289 | 3,922 |
| 290 | 1,945 |
| 291 | 8,468 |
| 292 | 17,420 |
| 293 | 8,301 |
| 294 | 6,601 |
| 295 | 12,385 |
| 296 | 4,494 |
| 297 | 15,570 |
| 298 | 2,386 |
| 299 | 9,109 |
| 300 | 5,181 |
| 301 | 8,935 |
HCreme Spreadsheet
| Flavor | Total Gallons Sold Same Qtr Last Yr |
| Vanilla | 55,339 |
| Chocolate | 76,851 |
| Strawberry | 22,432 |
| Maple Walnut | 11,428 |
| Praline | 14,605 |
| Butter Pecan | 16,249 |
| Chocolate Chip | 35,391 |
| Mint Chocolate Chip | 18,931 |
| Cookie Dough | 23,439 |
| Rocky Road | 16,492 |
| Fudge Swirl | 18,390 |
| Peach | 23,500 |
| Pumpkin | 5,234 |
| Marshmellow Fudge | 5,388 |
| Coffee | 43,231 |
| Mocha Chip | 33,231 |
| Rasberry | - |
| Watermelon | 19,338 |
| Cinnamon Spice | - |
Step by Step Solution
There are 3 Steps involved in it
Step: 1

Get Instant Access to Expert-Tailored Solutions
See step-by-step solutions with expert insights and AI powered tools for academic success
Step: 2

Step: 3
Ace Your Homework with AI
Get the answers you need in no time with our AI-driven, step-by-step assistance
Get Started
Lncs 8999 Databases In Networked Information Systems 10th International Workshop Dnis 2015 Aizu Wakamatsu Japan March 23 25 2015 Proceedings
Authors: Wanming Chu ,Shinji Kikuchi ,Subhash Bhalla
2015th Edition
3319163124, 978-3319163123