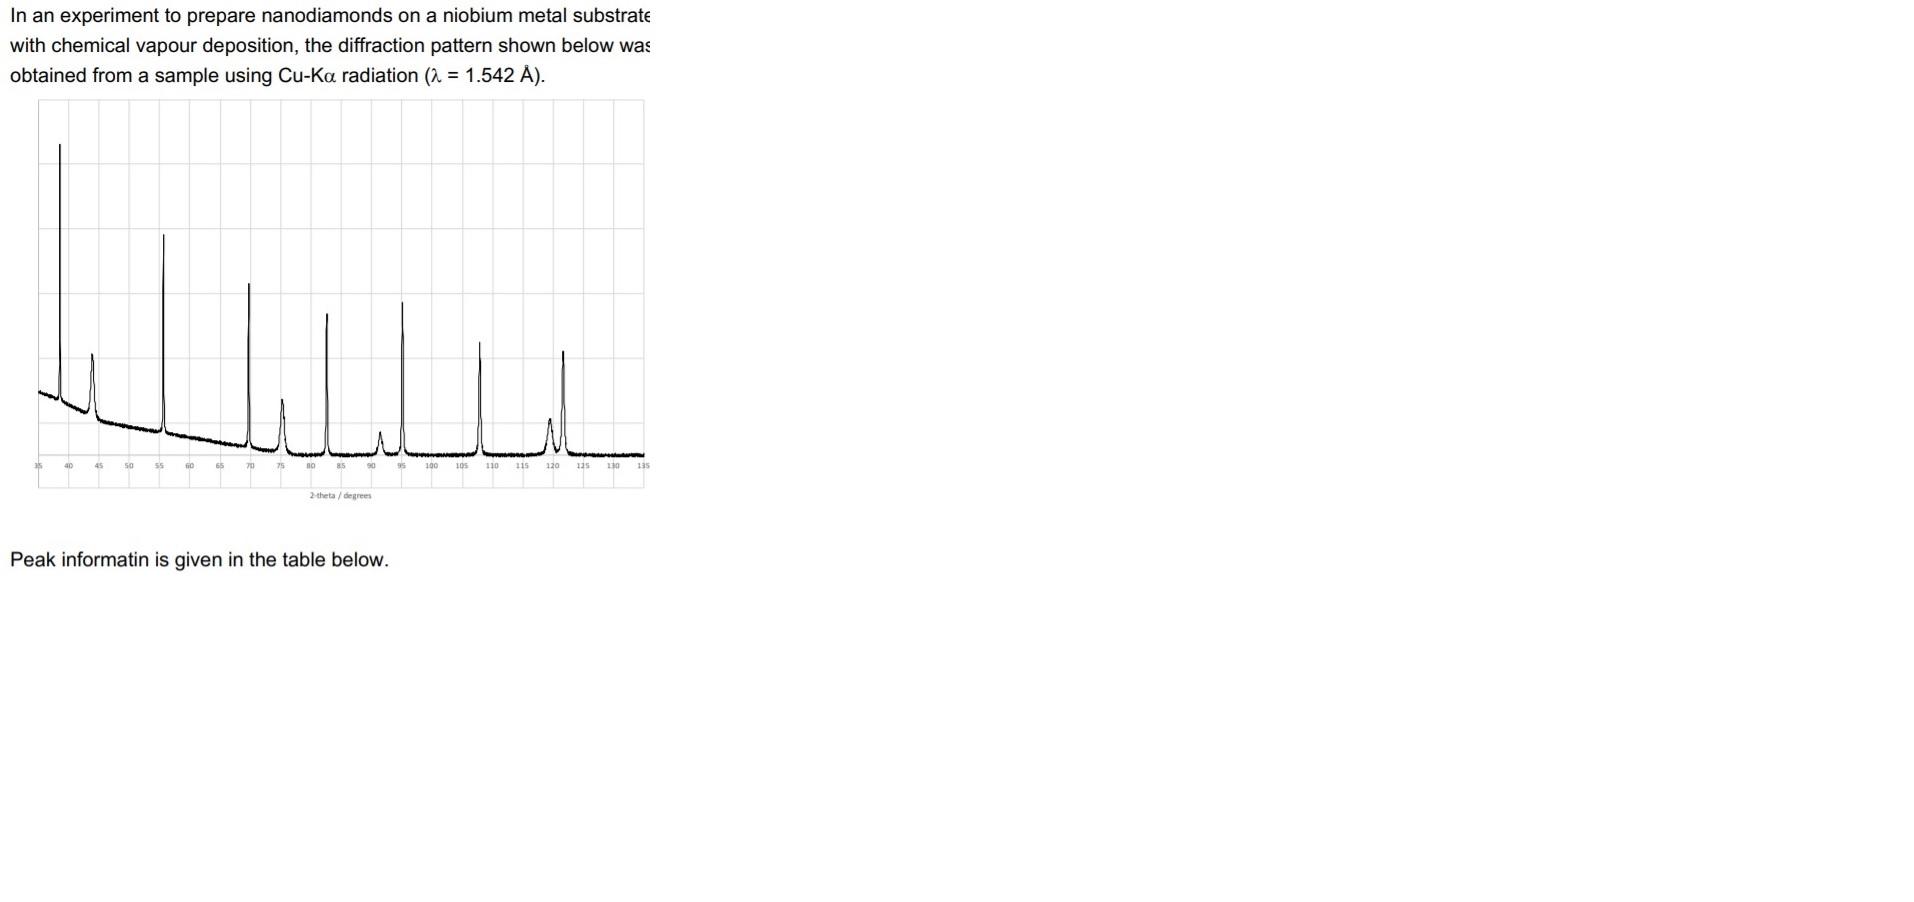
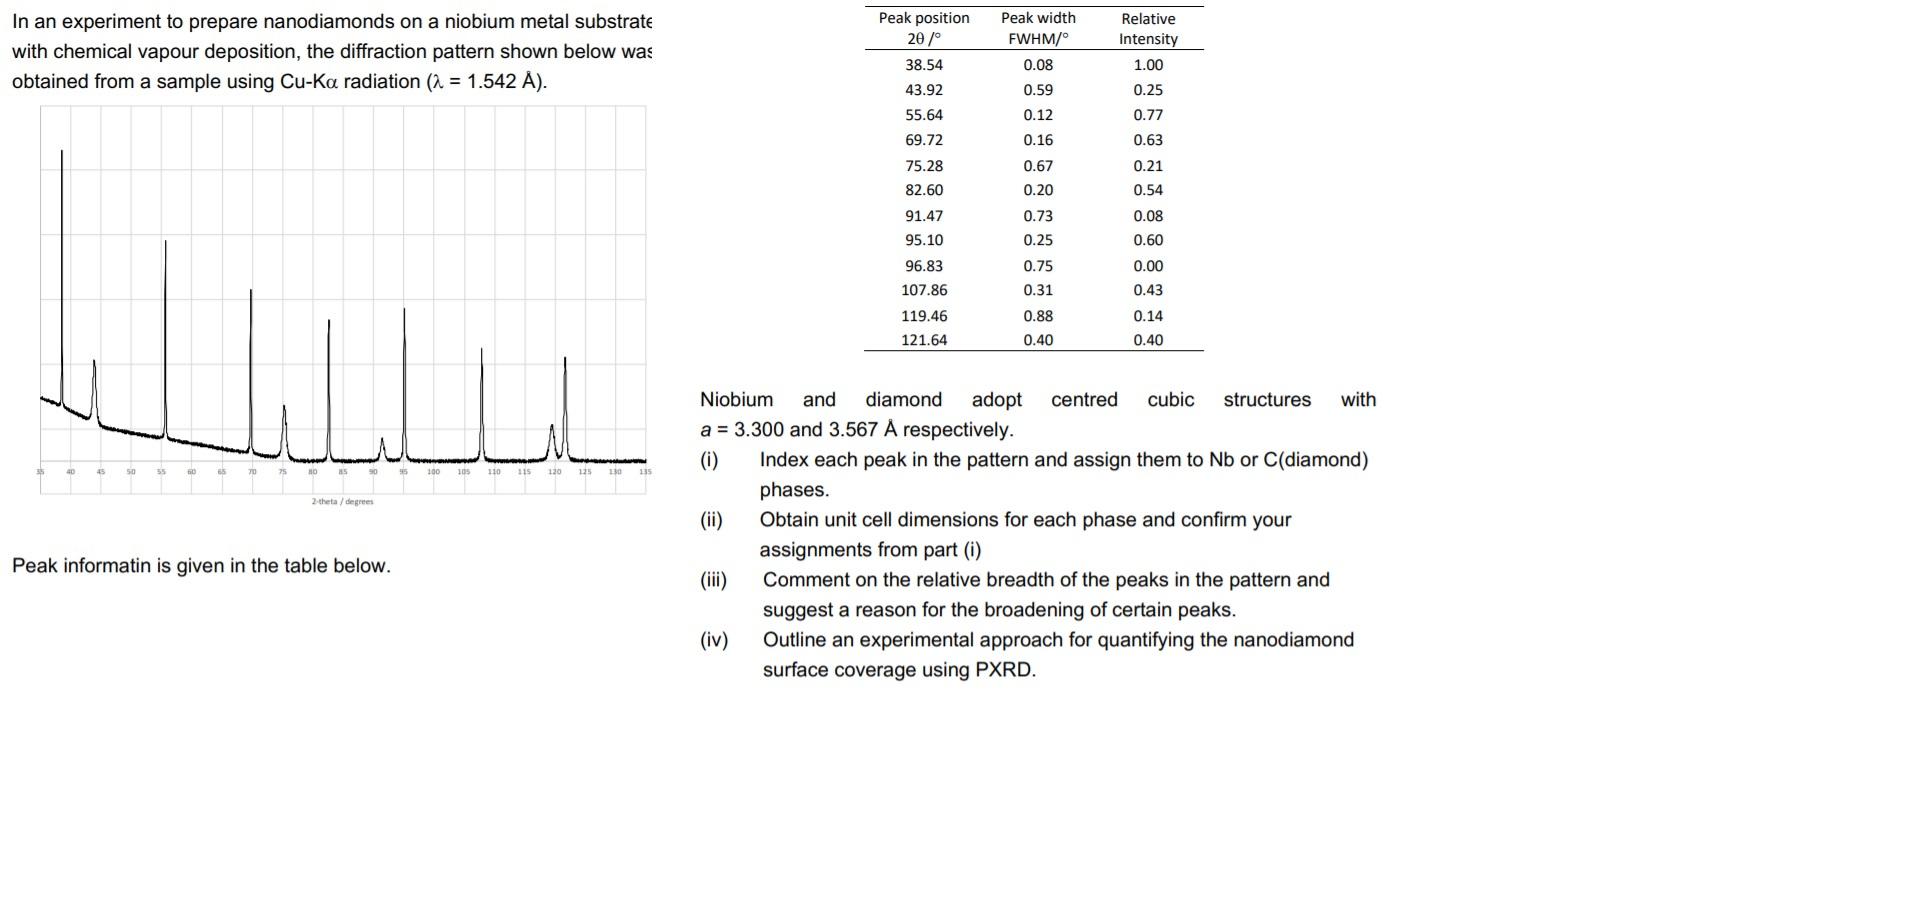
In an experiment to prepare nanodiamonds on a niobium metal substrate with chemical vapour deposition, the diffraction pattern shown below was obtained from a sample using Cu-Ka radiation (a = 1.542 A). Line 40 45 90 105 110 115 120 135 110 135 the degrees Peak informatin is given in the table below. In an experiment to prepare nanodiamonds on a niobium metal substrate with chemical vapour deposition, the diffraction pattern shown below was obtained from a sample using Cu-Ka radiation (a = 1.542 A). Peak position 20/ 38.54 Peak width FWHM/ 0.08 Relative Intensity 1.00 43.92 0.59 0.25 55.64 0.12 0.77 69.72 0.16 0.63 0.67 0.21 75.28 82.60 0.20 0.54 0.08 91.47 95.10 0.73 0.25 0.60 96.83 0.75 0.00 107.86 0.31 0.43 0.88 0.14 119.46 121.64 0.40 0.40 hu 100 105 110 115 120 125 130 2.theta/degrees Niobium and diamond adopt centred cubic structures with a = 3.300 and 3.567 A respectively. (0) Index each peak in the pattern and assign them to Nb or C(diamond) phases. (ii) Obtain unit cell dimensions for each phase and confirm your assignments from part (i) Comment on the relative breadth of the peaks in the pattern and suggest a reason for the broadening of certain peaks. (iv) Outline an experimental approach for quantifying the nanodiamond surface coverage using PXRD. Peak informatin is given in the table below. In an experiment to prepare nanodiamonds on a niobium metal substrate with chemical vapour deposition, the diffraction pattern shown below was obtained from a sample using Cu-Ka radiation (a = 1.542 A). Line 40 45 90 105 110 115 120 135 110 135 the degrees Peak informatin is given in the table below. In an experiment to prepare nanodiamonds on a niobium metal substrate with chemical vapour deposition, the diffraction pattern shown below was obtained from a sample using Cu-Ka radiation (a = 1.542 A). Peak position 20/ 38.54 Peak width FWHM/ 0.08 Relative Intensity 1.00 43.92 0.59 0.25 55.64 0.12 0.77 69.72 0.16 0.63 0.67 0.21 75.28 82.60 0.20 0.54 0.08 91.47 95.10 0.73 0.25 0.60 96.83 0.75 0.00 107.86 0.31 0.43 0.88 0.14 119.46 121.64 0.40 0.40 hu 100 105 110 115 120 125 130 2.theta/degrees Niobium and diamond adopt centred cubic structures with a = 3.300 and 3.567 A respectively. (0) Index each peak in the pattern and assign them to Nb or C(diamond) phases. (ii) Obtain unit cell dimensions for each phase and confirm your assignments from part (i) Comment on the relative breadth of the peaks in the pattern and suggest a reason for the broadening of certain peaks. (iv) Outline an experimental approach for quantifying the nanodiamond surface coverage using PXRD. Peak informatin is given in the table below