

Answered step by step
Verified Expert Solution
Question
1 Approved Answer
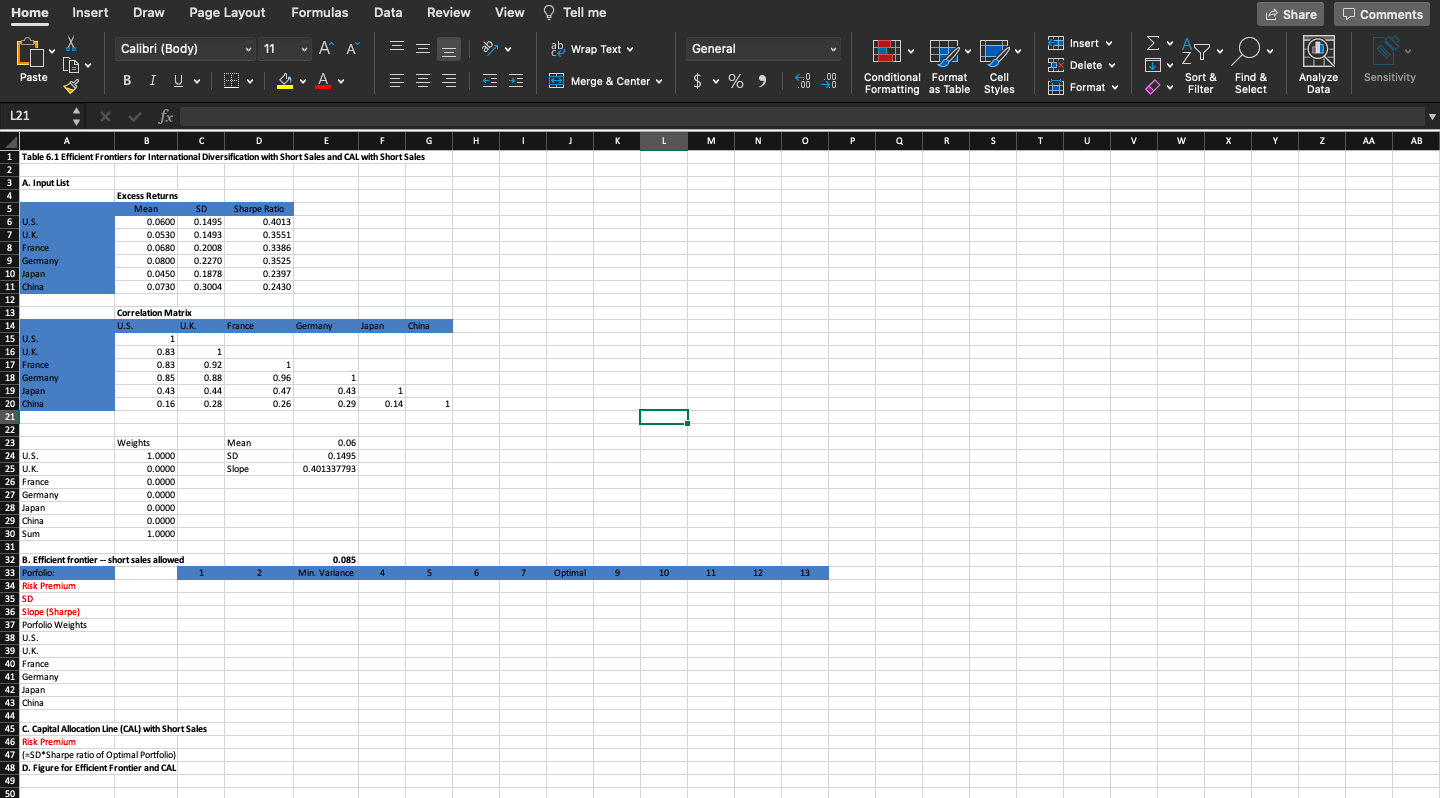
in case its hard to read for C and D: C. Capital Allocation Line (CAL) with Short Sales D. Figure for Efficient Frontier and CAL
 in case its hard to read for C and D:
C. Capital Allocation Line (CAL) with Short Sales
D. Figure for Efficient Frontier and CAL
Home Insert Draw Page Layout Formulas Data Review View Tell me Share Comments Calibri (Body) 11 DO Ch Insert v LG ab Wrap Text General FO V " ' ' MA 28 Or DX Delete v Paste BI U V V 3 & Merge & Center $ % ) V .00 0 .00 Conditional Format Cell Formatting as Table Styles Sort & Filter Sensitivity Format v Find & Select Analyze Data L21 fx H T J K L M N O P Q R S T T U V W Y Z AA AB A B C D E F G 1 Table 6.1 Efficient Frontiers for International Diversification with Short Sales and CAL with Short Sales 1 3 A. Input List 4 Excess Returns Mean SD Sharpe Ratio 6 U.S. 0.0600 0.1495 0.4013 7 U.K. 0.0530 0.1493 0.3551 8 France 0.0680 0.2008 0.3386 9 Germany 0.0800 0.2270 0.3525 10 Japan 0.0450 0.1878 0.2397 11 China 0.0730 0.3004 0.2430 12 13 Correlation Matrix 14 U.S. - U.K. France Germany Japan China 15 U.S. 1 16 U.K. 0.83 1 17 France 0.83 0.92 1 18 Germany 0.85 0.88 0.96 1 19 Japan 0.43 0.44 0.47 0.43 1 20 China 0.16 0.28 0.26 0.29 0.14 21 22 23 Weights Mean 0.06 24 U.S. 1.0000 SD 0.1495 25 U.K. 0.0000 Slope 0.401337793 26 France 0.0000 27 Germany 0.0000 28 Japan 0.0000 29 China 0.0000 30 Sum 1.0000 31 32 B. Efficient frontier - short sales allowed 0.085 33 Porfolio: 1 2. Min. Variance 4 5 34 Risk Premium 35 SD SD 36 Slope (Sharpe) 37 Porfolio Weights 38 U.S. 39 U.K. 40 France 41 Germany 42 Japan 43 China 44 45 C. Capital Allocation Line (CAL) with Short Sales 46 Risk Premium 47 (ESD*Sharpe ratio of Optimal Portfolio) 48 D. Figure for Efficient Frontier and CAL 49 50 6 7 Optimal 9 9 10 11 12 13 Home Insert Draw Page Layout Formulas Data Review View Tell me Share Comments Calibri (Body) 11 DO Ch Insert v LG ab Wrap Text General FO V " ' ' MA 28 Or DX Delete v Paste BI U V V 3 & Merge & Center $ % ) V .00 0 .00 Conditional Format Cell Formatting as Table Styles Sort & Filter Sensitivity Format v Find & Select Analyze Data L21 fx H T J K L M N O P Q R S T T U V W Y Z AA AB A B C D E F G 1 Table 6.1 Efficient Frontiers for International Diversification with Short Sales and CAL with Short Sales 1 3 A. Input List 4 Excess Returns Mean SD Sharpe Ratio 6 U.S. 0.0600 0.1495 0.4013 7 U.K. 0.0530 0.1493 0.3551 8 France 0.0680 0.2008 0.3386 9 Germany 0.0800 0.2270 0.3525 10 Japan 0.0450 0.1878 0.2397 11 China 0.0730 0.3004 0.2430 12 13 Correlation Matrix 14 U.S. - U.K. France Germany Japan China 15 U.S. 1 16 U.K. 0.83 1 17 France 0.83 0.92 1 18 Germany 0.85 0.88 0.96 1 19 Japan 0.43 0.44 0.47 0.43 1 20 China 0.16 0.28 0.26 0.29 0.14 21 22 23 Weights Mean 0.06 24 U.S. 1.0000 SD 0.1495 25 U.K. 0.0000 Slope 0.401337793 26 France 0.0000 27 Germany 0.0000 28 Japan 0.0000 29 China 0.0000 30 Sum 1.0000 31 32 B. Efficient frontier - short sales allowed 0.085 33 Porfolio: 1 2. Min. Variance 4 5 34 Risk Premium 35 SD SD 36 Slope (Sharpe) 37 Porfolio Weights 38 U.S. 39 U.K. 40 France 41 Germany 42 Japan 43 China 44 45 C. Capital Allocation Line (CAL) with Short Sales 46 Risk Premium 47 (ESD*Sharpe ratio of Optimal Portfolio) 48 D. Figure for Efficient Frontier and CAL 49 50 6 7 Optimal 9 9 10 11 12 13Step by Step Solution
There are 3 Steps involved in it
Step: 1

Get Instant Access to Expert-Tailored Solutions
See step-by-step solutions with expert insights and AI powered tools for academic success
Step: 2

Step: 3
Ace Your Homework with AI
Get the answers you need in no time with our AI-driven, step-by-step assistance
Get Started
Sovereign Debt Sustainability Multilateral Debt Treatment And The Credit Rating Impasse
Authors: Daniel Cash
1st Edition
1032198656, 978-1032198651