Answered step by step
Verified Expert Solution
Link Copied!

Question

1 Approved Answer

In exercises 7-10, consider the following survey questions. 7. What do students in your high-school like to spend their money on? a. Which categories would
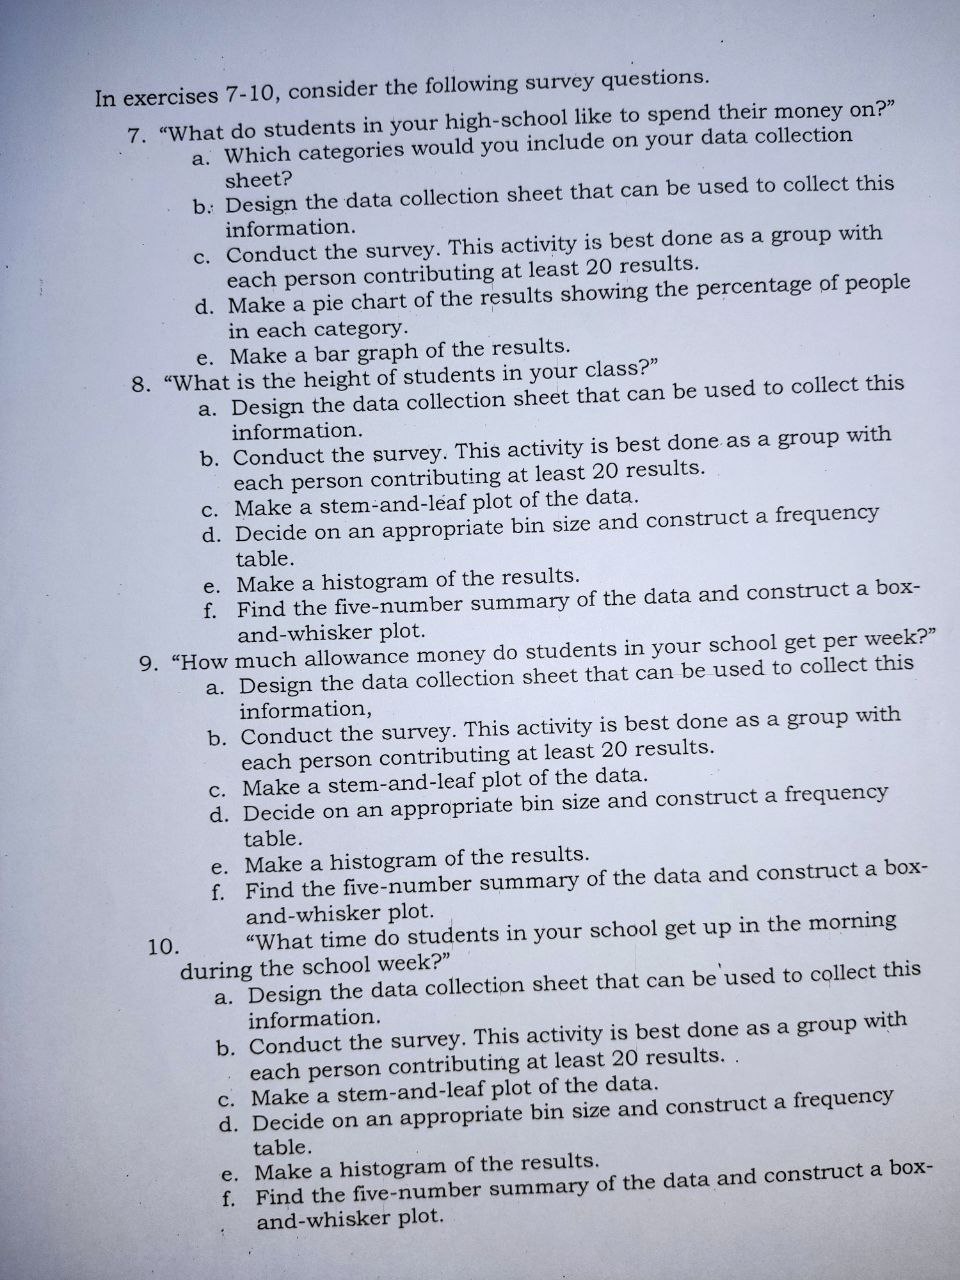
image text in transcribed
In exercises 7-10, consider the following survey questions. 7. "What do students in your high-school like to spend their money on?" a. Which categories would you include on your data collection sheet? b. Design the data collection sheet that can be used to collect this information. c. Conduct the survey. This activity is best done as a group with each person contributing at least 20 results. d. Make a pie chart of the results showing the percentage of people in each category. e. Make a bar graph of the results. 8. "What is the height of students in your class?" a. Design the data collection sheet that can be used to collect this information. b. Conduct the survey. This activity is best done as a group with each person contributing at least 20 results. c. Make a stem-and-leaf plot of the data. d. Decide on an appropriate bin size and construct a frequency table. e. Make a histogram of the results. f. Find the five-number summary of the data and construct a box- and-whisker plot. 9. "How much allowance money do students in your school get per week?" a. Design the data collection sheet that can be used to collect this information, b. Conduct the survey. This activity is best done as a group with each person contributing at least 20 results. c. Make a stem-and-leaf plot of the data. d. Decide on an appropriate bin size and construct a frequency table. e. Make a histogram of the results. f. Find the five-number summary of the data and construct a box- and-whisker plot. 10. "What time do students in your school get up in the morning during the school week?" a. Design the data collection sheet that can be used to collect this information. b. Conduct the survey. This activity is best done as a group with each person contributing at least 20 results. c. Make a stem-and-leaf plot of the data. d. Decide on an appropriate bin size and construct a frequency table. e. Make a histogram of the results. f. Find the five-number summary of the data and construct a box- and-whisker plot

Step by Step Solution

There are 3 Steps involved in it

Step: 1

blur-text-image

Get Instant Access to Expert-Tailored Solutions

See step-by-step solutions with expert insights and AI powered tools for academic success

Step: 2

blur-text-image

Step: 3

blur-text-image

Ace Your Homework with AI

Get the answers you need in no time with our AI-driven, step-by-step assistance

Get Started

Recommended Textbook for

Macroeconomics Principles and Applications

Authors: Robert e. hall, marc Lieberman

5th edition

1111397465, 9781439038970, 1439038988, 978-1111397463, 143903897X, 9781439038987, 978-1133265238

More Books

Students also viewed these Economics questions