Answered step by step
Verified Expert Solution
Question
1 Approved Answer
In Homework 1, I expect you to replicate the above analysis. Specifically, your goal is to help Kirin identify a potential new beer based on
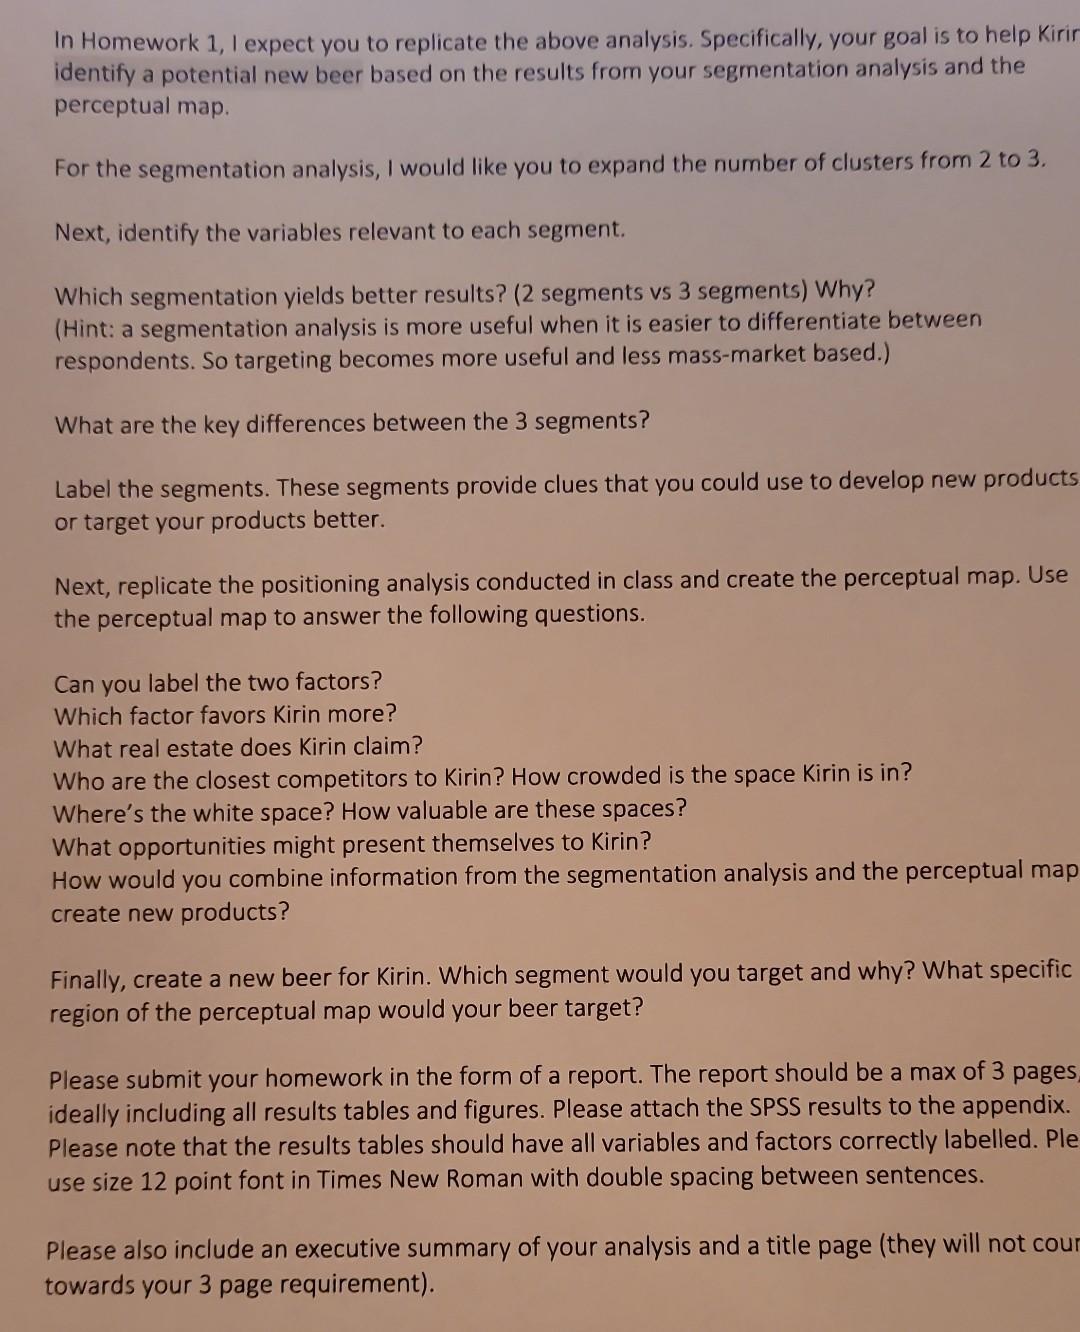
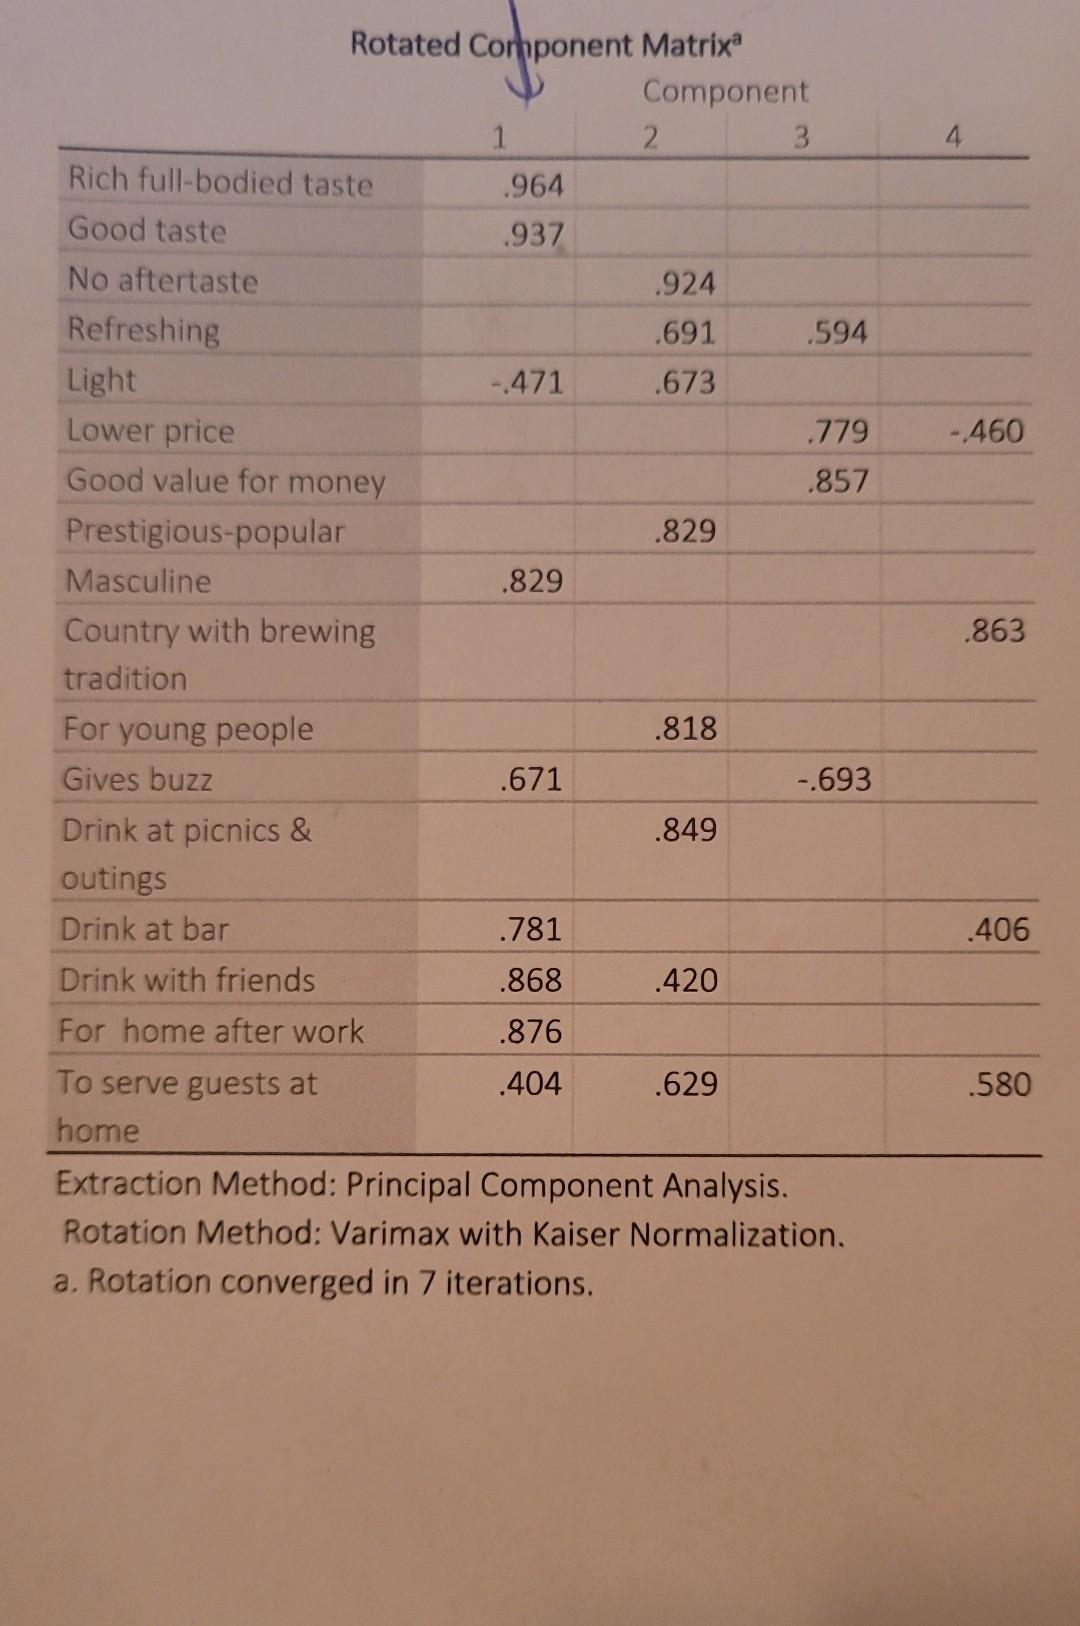
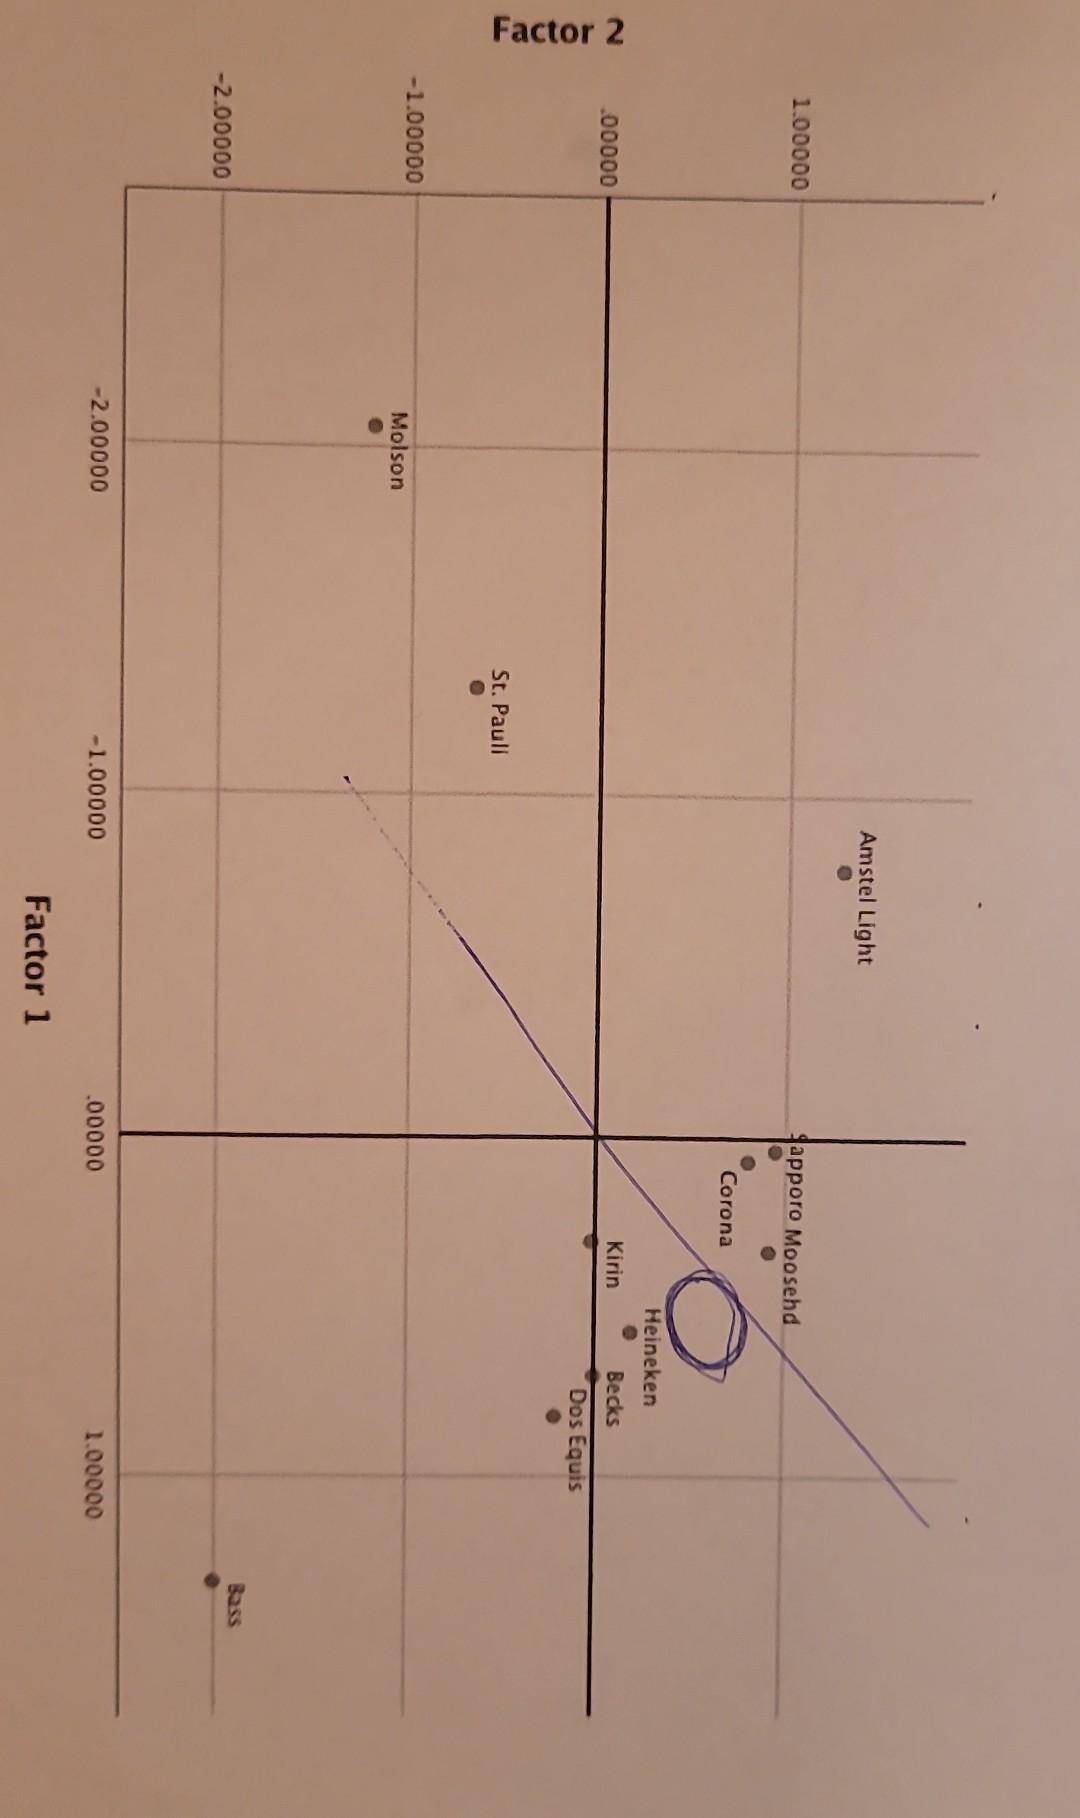
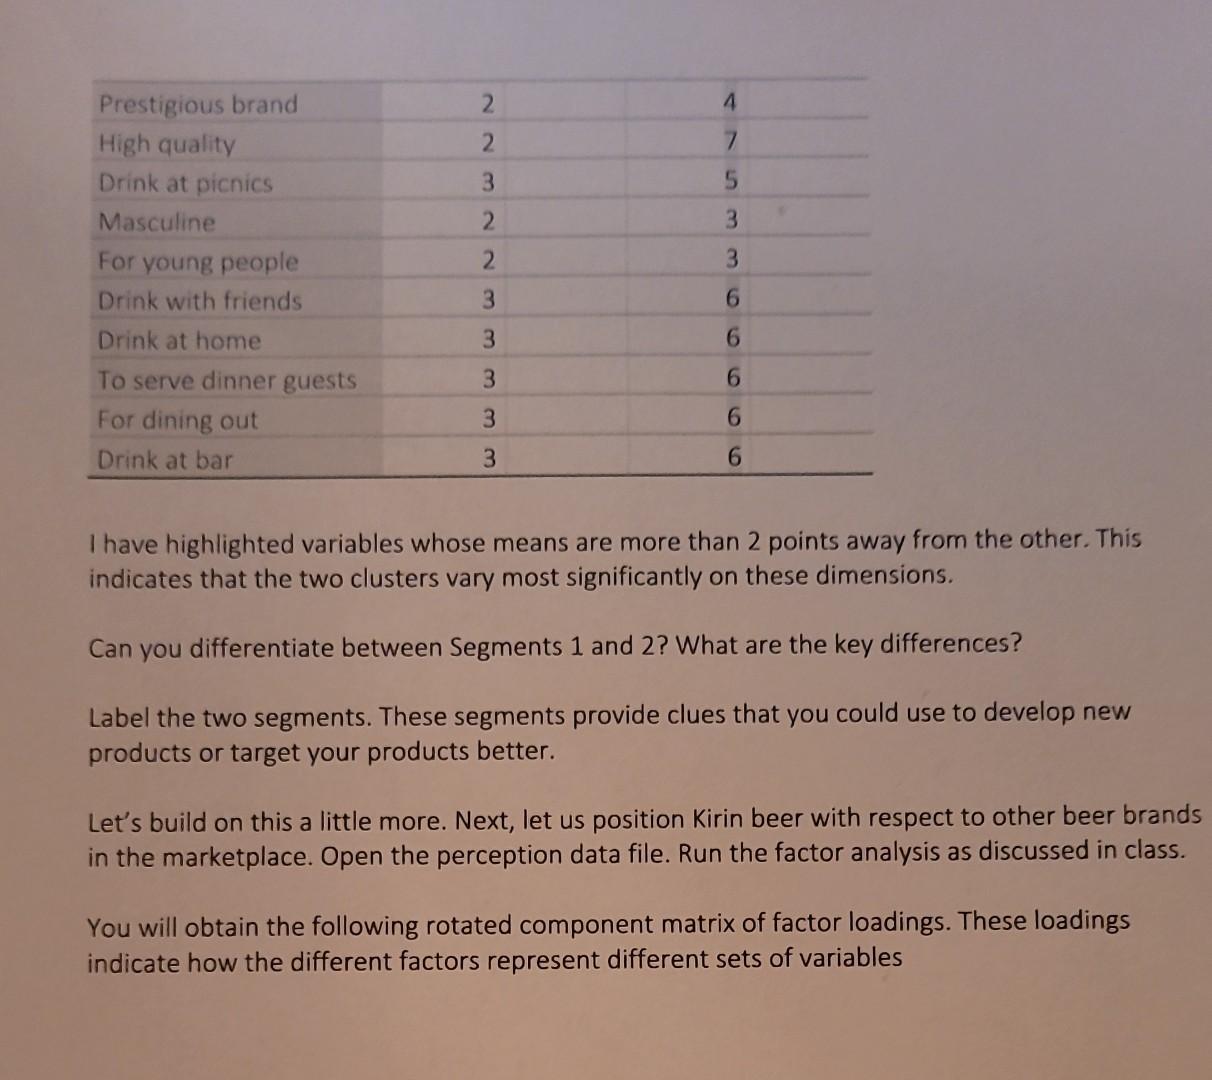
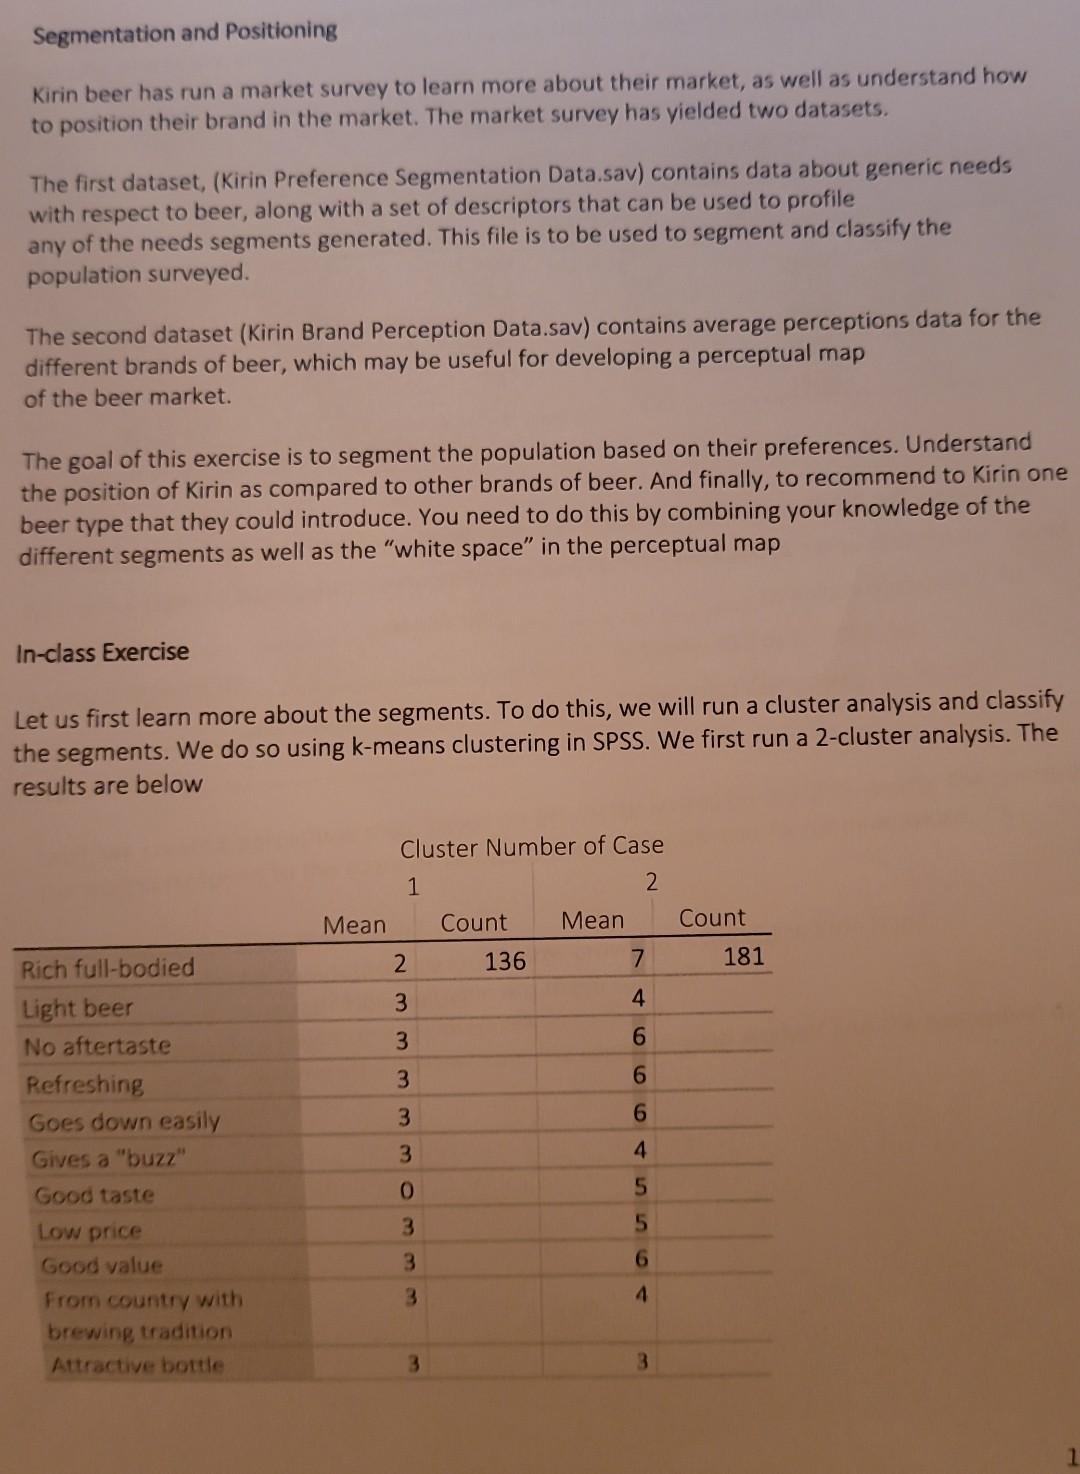
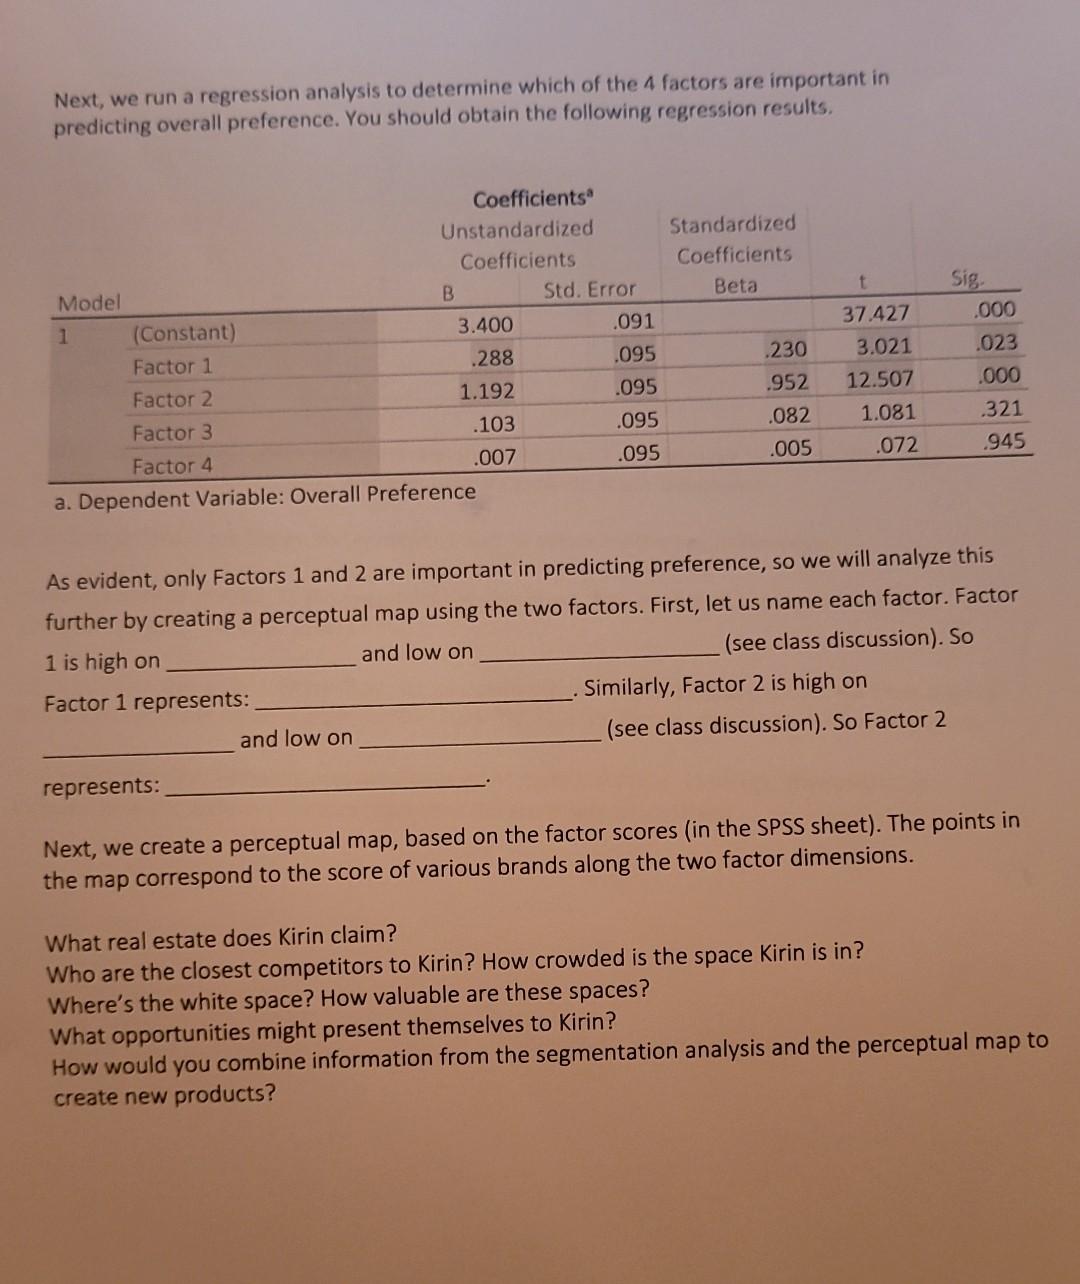
In Homework 1, I expect you to replicate the above analysis. Specifically, your goal is to help Kirin identify a potential new beer based on the results from your segmentation analysis and the perceptual map. For the segmentation analysis, I would like you to expand the number of clusters from 2 to 3 . Next, identify the variables relevant to each segment. Which segmentation yields better results? (2 segments vs 3 segments) Why? (Hint: a segmentation analysis is more useful when it is easier to differentiate between respondents. So targeting becomes more useful and less mass-market based.) What are the key differences between the 3 segments? Label the segments. These segments provide clues that you could use to develop new products or target your products better. Next, replicate the positioning analysis conducted in class and create the perceptual map. Use the perceptual map to answer the following questions. Can you label the two factors? Which factor favors Kirin more? What real estate does Kirin claim? Who are the closest competitors to Kirin? How crowded is the space Kirin is in? Where's the white space? How valuable are these spaces? What opportunities might present themselves to Kirin? How would you combine information from the segmentation analysis and the perceptual map create new products? Finally, create a new beer for Kirin. Which segment would you target and why? What specific region of the perceptual map would your beer target? Please submit your homework in the form of a report. The report should be a max of 3 pages ideally including all results tables and figures. Please attach the SPSS results to the appendix. Please note that the results tables should have all variables and factors correctly labelled. Ple use size 12 point font in Times New Roman with double spacing between sentences. Please also include an executive summary of your analysis and a title page (they will not cou towards your 3 page requirement). Rotation Method: Varimax with Kaiser Normalization. a. Rotation converged in 7 iterations. Factor 2 I have highlighted variables whose means are more than 2 points away from the other. This indicates that the two clusters vary most significantly on these dimensions. Can you differentiate between Segments 1 and 2? What are the key differences? Label the two segments. These segments provide clues that you could use to develop new products or target your products better. Let's build on this a little more. Next, let us position Kirin beer with respect to other beer brano in the marketplace. Open the perception data file. Run the factor analysis as discussed in class. You will obtain the following rotated component matrix of factor loadings. These loadings indicate how the different factors represent different sets of variables Segmentation and Positioning Kirin beer has run a market survey to learn more about their market, as well as understand how to position their brand in the market. The market survey has yielded two datasets. The first dataset, (Kirin Preference Segmentation Data.sav) contains data about generic needs with respect to beer, along with a set of descriptors that can be used to profile any of the needs segments generated. This file is to be used to segment and classify the population surveyed. The second dataset (Kirin Brand Perception Data.sav) contains average perceptions data for the different brands of beer, which may be useful for developing a perceptual map of the beer market. The goal of this exercise is to segment the population based on their preferences. Understand the position of Kirin as compared to other brands of beer. And finally, to recommend to Kirin one beer type that they could introduce. You need to do this by combining your knowledge of the different segments as well as the "white space" in the perceptual map In-class Exercise Let us first learn more about the segments. To do this, we will run a cluster analysis and classify the segments. We do so using k-means clustering in SPSS. We first run a 2-cluster analysis. The results are below Next, we run a regression analysis to determine which of the 4 factors are important in predicting overall preference. You should obtain the following regression results. a. Dependent Variable: Overall Preference As evident, only Factors 1 and 2 are important in predicting preference, so we will analyze this further by creating a perceptual map using the two factors. First, let us name each factor. Factor 1 is high on and low on (see class discussion). So Factor 1 represents: . Similarly, Factor 2 is high on and low on (see class discussion). So Factor 2 represents: Next, we create a perceptual map, based on the factor scores (in the SPSS sheet). The points in the map correspond to the score of various brands along the two factor dimensions. What real estate does Kirin claim? Who are the closest competitors to Kirin? How crowded is the space Kirin is in? Where's the white space? How valuable are these spaces? What opportunities might present themselves to Kirin? How would you combine information from the segmentation analysis and the perceptual map to create new products? In Homework 1, I expect you to replicate the above analysis. Specifically, your goal is to help Kirin identify a potential new beer based on the results from your segmentation analysis and the perceptual map. For the segmentation analysis, I would like you to expand the number of clusters from 2 to 3 . Next, identify the variables relevant to each segment. Which segmentation yields better results? (2 segments vs 3 segments) Why? (Hint: a segmentation analysis is more useful when it is easier to differentiate between respondents. So targeting becomes more useful and less mass-market based.) What are the key differences between the 3 segments? Label the segments. These segments provide clues that you could use to develop new products or target your products better. Next, replicate the positioning analysis conducted in class and create the perceptual map. Use the perceptual map to answer the following questions. Can you label the two factors? Which factor favors Kirin more? What real estate does Kirin claim? Who are the closest competitors to Kirin? How crowded is the space Kirin is in? Where's the white space? How valuable are these spaces? What opportunities might present themselves to Kirin? How would you combine information from the segmentation analysis and the perceptual map create new products? Finally, create a new beer for Kirin. Which segment would you target and why? What specific region of the perceptual map would your beer target? Please submit your homework in the form of a report. The report should be a max of 3 pages ideally including all results tables and figures. Please attach the SPSS results to the appendix. Please note that the results tables should have all variables and factors correctly labelled. Ple use size 12 point font in Times New Roman with double spacing between sentences. Please also include an executive summary of your analysis and a title page (they will not cou towards your 3 page requirement). Rotation Method: Varimax with Kaiser Normalization. a. Rotation converged in 7 iterations. Factor 2 I have highlighted variables whose means are more than 2 points away from the other. This indicates that the two clusters vary most significantly on these dimensions. Can you differentiate between Segments 1 and 2? What are the key differences? Label the two segments. These segments provide clues that you could use to develop new products or target your products better. Let's build on this a little more. Next, let us position Kirin beer with respect to other beer brano in the marketplace. Open the perception data file. Run the factor analysis as discussed in class. You will obtain the following rotated component matrix of factor loadings. These loadings indicate how the different factors represent different sets of variables Segmentation and Positioning Kirin beer has run a market survey to learn more about their market, as well as understand how to position their brand in the market. The market survey has yielded two datasets. The first dataset, (Kirin Preference Segmentation Data.sav) contains data about generic needs with respect to beer, along with a set of descriptors that can be used to profile any of the needs segments generated. This file is to be used to segment and classify the population surveyed. The second dataset (Kirin Brand Perception Data.sav) contains average perceptions data for the different brands of beer, which may be useful for developing a perceptual map of the beer market. The goal of this exercise is to segment the population based on their preferences. Understand the position of Kirin as compared to other brands of beer. And finally, to recommend to Kirin one beer type that they could introduce. You need to do this by combining your knowledge of the different segments as well as the "white space" in the perceptual map In-class Exercise Let us first learn more about the segments. To do this, we will run a cluster analysis and classify the segments. We do so using k-means clustering in SPSS. We first run a 2-cluster analysis. The results are below Next, we run a regression analysis to determine which of the 4 factors are important in predicting overall preference. You should obtain the following regression results. a. Dependent Variable: Overall Preference As evident, only Factors 1 and 2 are important in predicting preference, so we will analyze this further by creating a perceptual map using the two factors. First, let us name each factor. Factor 1 is high on and low on (see class discussion). So Factor 1 represents: . Similarly, Factor 2 is high on and low on (see class discussion). So Factor 2 represents: Next, we create a perceptual map, based on the factor scores (in the SPSS sheet). The points in the map correspond to the score of various brands along the two factor dimensions. What real estate does Kirin claim? Who are the closest competitors to Kirin? How crowded is the space Kirin is in? Where's the white space? How valuable are these spaces? What opportunities might present themselves to Kirin? How would you combine information from the segmentation analysis and the perceptual map to create new products
Step by Step Solution
There are 3 Steps involved in it
Step: 1

Get Instant Access to Expert-Tailored Solutions
See step-by-step solutions with expert insights and AI powered tools for academic success
Step: 2

Step: 3

Ace Your Homework with AI
Get the answers you need in no time with our AI-driven, step-by-step assistance
Get Started


