

Answered step by step
Verified Expert Solution
Question
1 Approved Answer
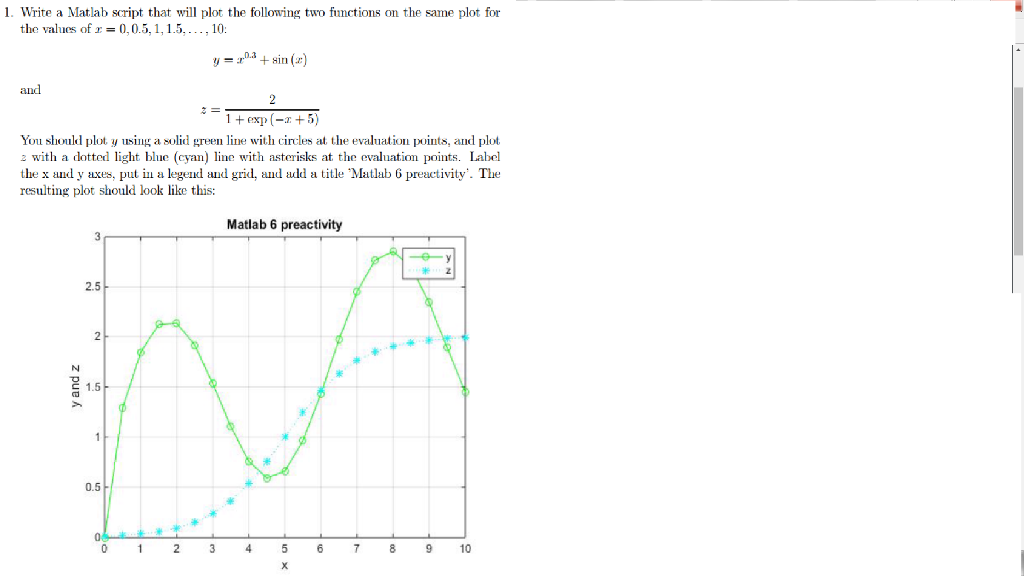
(in Matlab) 1. Write a Matlab script that will plot the following two functions on the same plot for the values of 0,0.5,1,1.5,...,10: y- n
(in Matlab)
Step by Step Solution
There are 3 Steps involved in it
Step: 1

Get Instant Access to Expert-Tailored Solutions
See step-by-step solutions with expert insights and AI powered tools for academic success
Step: 2

Step: 3
Ace Your Homework with AI
Get the answers you need in no time with our AI-driven, step-by-step assistance
Get Started
Oracle Database 12c Dba Handbook Manage A Scalable Secure Oracle Enterprise Database Environment
Authors: Bob Bryla
1st Edition
0071798781, 978-0071798785