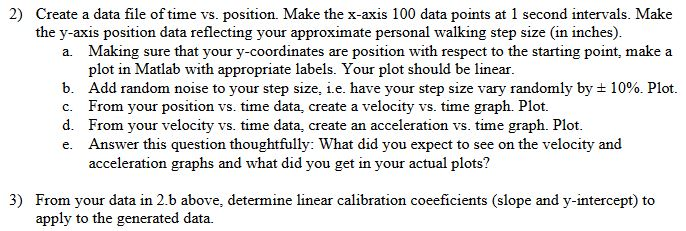
Question: In matlab, create a data array of time vs. position. Make the x-axis 100 data points at 1 second intervals. Make the y-axis position data
In matlab, create a data array of time vs. position. Make the x-axis 100 data points at 1 second intervals. Make the y-axis position data reflecting your approximate personal walking step size (in inches). Do not create a data file, use an array instead.

2) Create a data file of time vs position. Make the x axis 100 data points at 1 second intervals. Make the y-axis position data reflecting your approximate personal walking step size (in inches). Making sure that your y-coordinates are position with respect to the starting point, make a plot in Matlab with appropriate labels. Your plot should be linear Add random noise to your step size, ie. have your step size vary randomly by 10%. Plot From your position vs. time data, create a velocity vs. time graph. Plot. From your velocity vs. time data, create an acceleration vs. time graph. Plot. Answer this question thoughtfully: What did you expect to see on the velocity and acceleration graphs and what did you get in your actual plots? a. b. c. d. e. 3) From your data in 2.b above, determine linear calibration coeeficients (slope and y-intercept) to apply to the generated data
Step by Step Solution
There are 3 Steps involved in it

Get step-by-step solutions from verified subject matter experts


