 In MATLAB
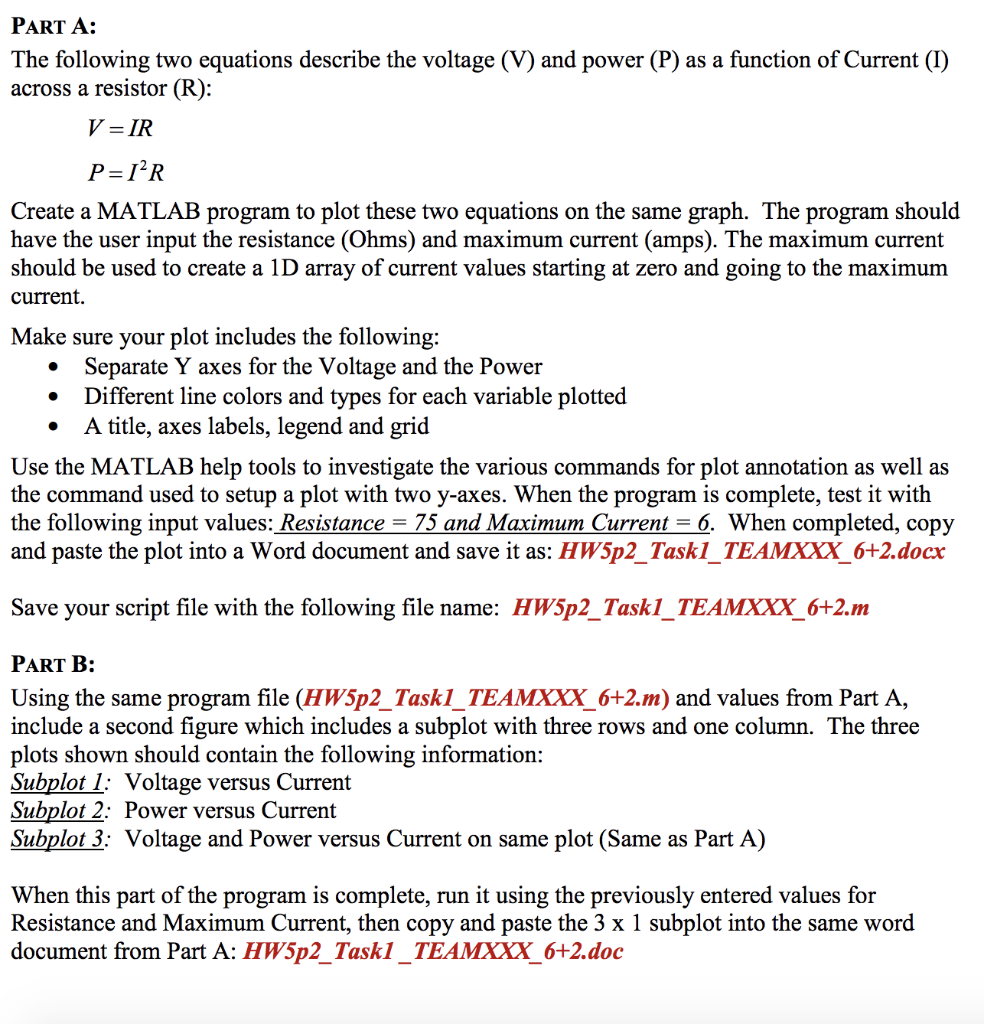
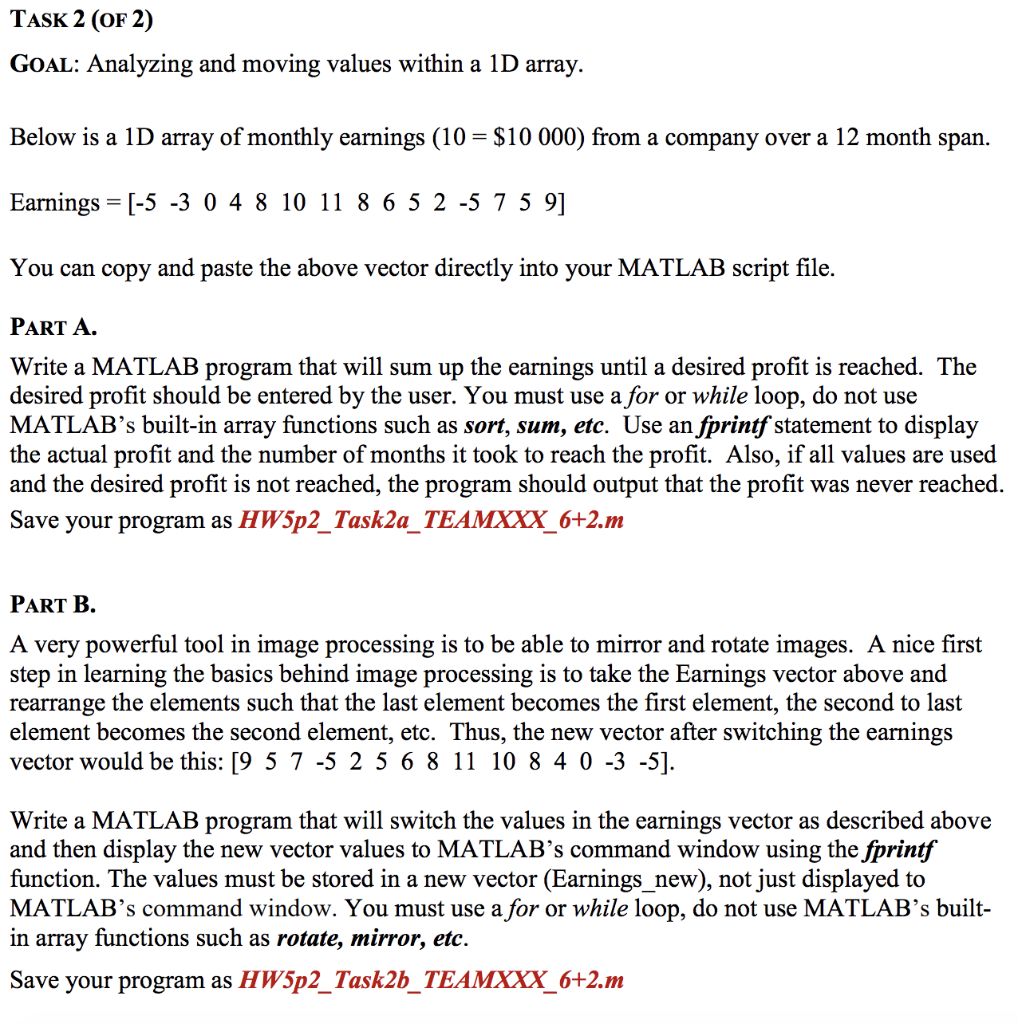
PART A: The following two equations describe the voltage (V) and power (P) as a function of Current (1) across a resistor (R): V = IR P=12R Create a MATLAB program to plot these two equations on the same graph. The program should have the user input the resistance (Ohms) and maximum current (amps). The maximum current should be used to create a 1D array of current values starting at zero and going to the maximum current. Make sure your plot includes the following: Separate Y axes for the Voltage and the Power Different line colors and types for each variable plotted A title, axes labels, legend and grid Use the MATLAB help tools to investigate the various commands for plot annotation as well as the command used to setup a plot with two y-axes. When the program is complete, test it with the following input values: Resistance = 75 and Maximum Current = 6. When completed, copy and paste the plot into a Word document and save it as: HW5p2_Taskl_TEAMXXX_6+2.docx Save your script file with the following file name: HW5p2_Taskl_TEAMXXX_6+2.m PART B: Using the same program file (HW5p2_Taskl_TEAMXXX_6+2.m) and values from Part A, lude a second figure which includes a subplot with three rows and one column. The three plots shown should contain the following information: Subplot 1: Voltage versus Current Subplot 2: Power versus Current Subplot 3: Voltage and Power versus Current on same plot (Same as Part A) When this part of the program is complete, run it using the previously entered values for Resistance and Maximum Current, then copy and paste the 3 x 1 subplot into the same word document from Part A: HW5p2_Taskl _TEAMXXX_6+2.doc TASK 2 (OF 2) GOAL: Analyzing and moving values within a 1D array. Below is a 1D array of monthly earnings (10 = $10 000) from a company over a 12 month span. Earnings = [-5 -3 0 4 8 10 11 8 6 5 2 -5 7 5 9] You can copy and paste the above vector directly into your MATLAB script file. PART A. Write a MATLAB program that will sum up the earnings until a desired profit is reached. The desired profit should be entered by the user. You must use a for or while loop, do not use MATLAB's built-in array functions such as sort, sum, etc. Use an fprintf statement to display the actual profit and the number of months it took to reach the profit. Also, if all values are used and the desired profit is not reached, the program should output that the profit was never reached. Save your program as HW5p2_Task2a_TEAMXXX_6+2.m PART B. A very powerful tool in image processing is to be able to mirror and rotate images. A nice first step in learning the basics behind image processing is to take the Earnings vector above and rearrange the elements such that the last element becomes the first element, the second to last element becomes the second element, etc. Thus, the new vector after switching the earnings vector would be this: 19 5 7 -5 2 5 6 8 11 10 8 4 0 -3 -5]. Write a MATLAB program that will switch the values in the earnings vector as described above and then display the new vector values to MATLAB's command window using the fprintf function. The values must be stored in a new vector (Earnings new), not just displayed to MATLAB's command window. You must use a for or while loop, do not use MATLAB's built- in array functions such as rotate, mirror, etc Save your program as HW5p2_Task2b_TEAMXXX_6+2.m