

Question
In Matlab, plot the time series data for the given data below. The first column is year, and every column after that is the months.
In Matlab, plot the time series data for the given data below. The first column is year, and every column after that is the months. The X axis will be years. Please show the code. The plot should be similar to the image attached.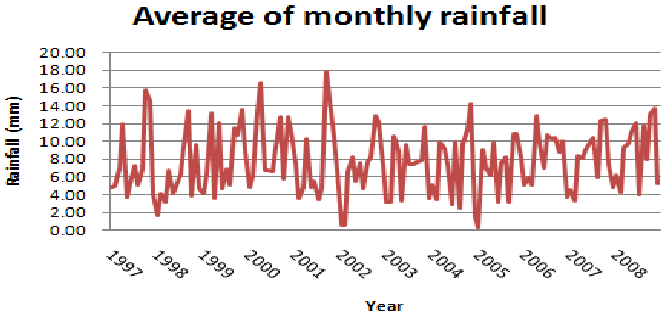
20.00 18.00 16.00 14.00 E 12.00 10.00 8.00 6.00 4.00 2.00 o.OO Average of monthly rainfall Year
Step by Step Solution
There are 3 Steps involved in it
Step: 1

Get Instant Access to Expert-Tailored Solutions
See step-by-step solutions with expert insights and AI powered tools for academic success
Step: 2

Step: 3
Ace Your Homework with AI
Get the answers you need in no time with our AI-driven, step-by-step assistance
Get Started
Linked Data A Geographic Perspective
Authors: Glen Hart, Catherine Dolbear
1st Edition
1000218910, 9781000218916