

Question
In Python 3.6: I had posted this question before, but never recieved an answer. Please help, this is due today. We are using Python 3.6
In Python 3.6: I had posted this question before, but never recieved an answer. Please help, this is due today. We are using Python 3.6 and I have also provided the links below to download the binary file (image_matrix) and the helper module to complete this assignment. We need to create two functions according to the homework. The only thing that I have figured out how to do so far is simply how to read in the binary file using pickle. Please write simple functions and not too advanced because we have not covered a lot of the advanced topics yet.
The binary file is called image_matrix and can be download here, I have also verified that the link works by downloading the file myself: https://expirebox.com/download/9abb6a40db04bfd64446d1b6c92fdad4.html
The helper module, hist_machine, can be downloaded here and I have also tried downloading and it works: https://expirebox.com/download/4f79c767369f83b6f5605c0dddc26488.html
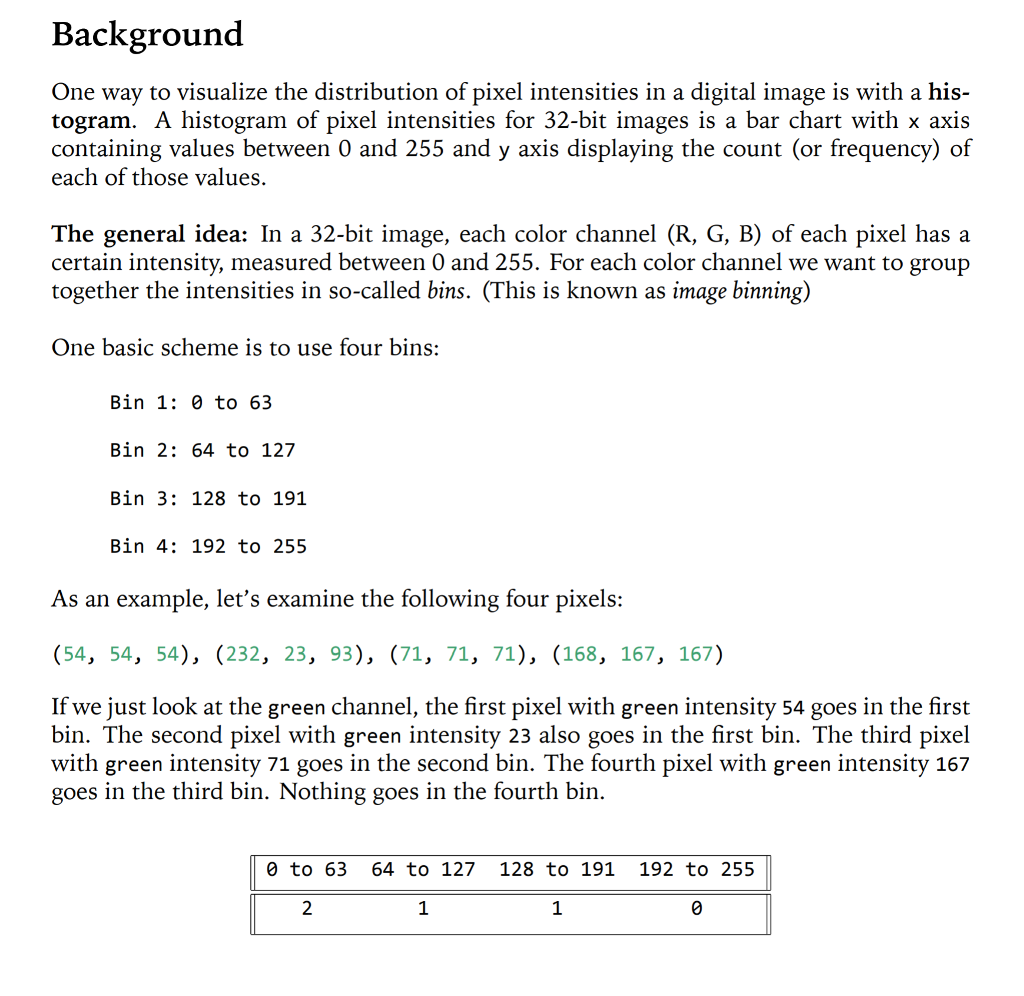
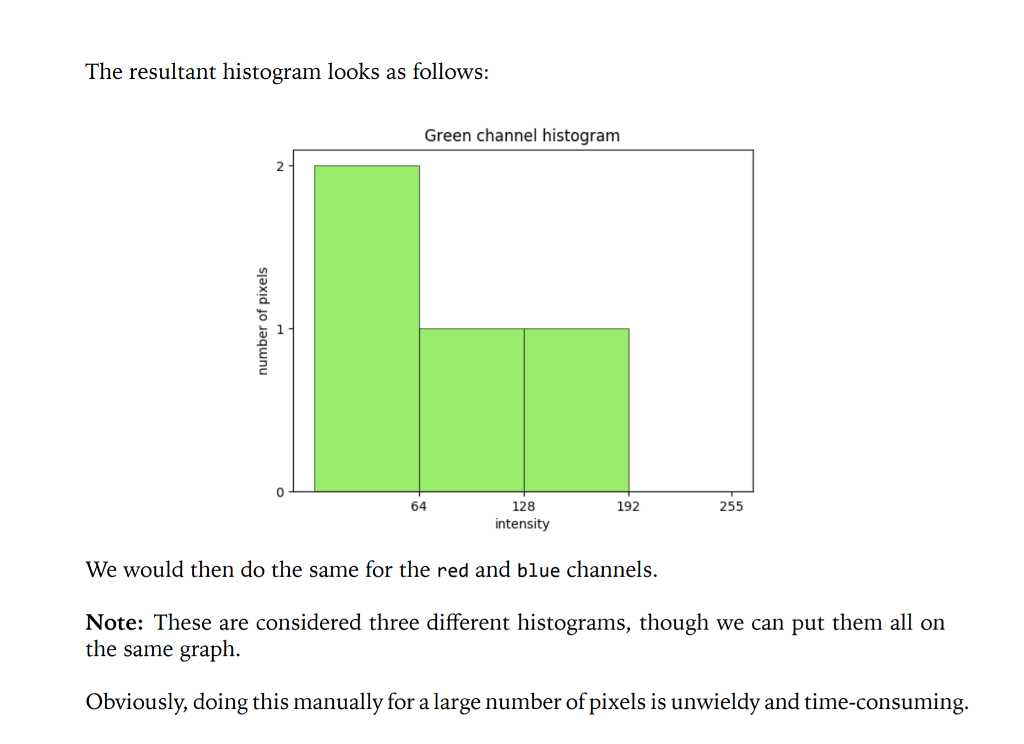
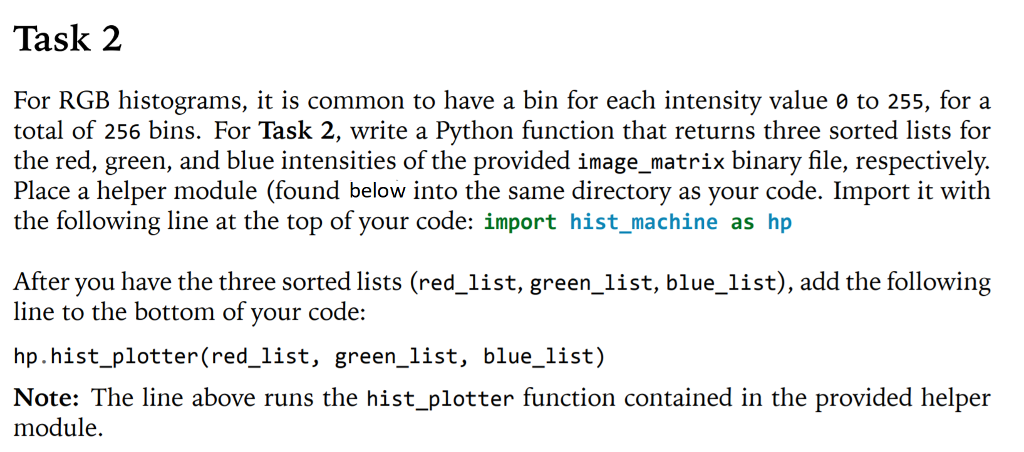
Background One way to visualize the distribution of pixel intensities in a digital image is with a his- togram. A histogram of pixel intensities for 32-bit images is a bar chart with x axis containing values between 0 and 255 and y axis displaying the count (or frequency) of each of those values. The general idea: In a 32-bit image, each color channel (R, G, B) of each pixel has a certain intensity, measured between 0 and 255. For each color channel we want to group together the intensities in so-called bins. (This is known as i nage binning) One basic scheme is to use four bins: Bin 1: 0 to 63 Bin 2: 64 to 127 Bin 3: 128 to 191 Bin 4: 192 to 255 As an example, let's examine the following four pixels: (54, 54, 54), (232, 23, 93), (71, 71, 71), (168, 167, 167) If we just look at the green channel, the first pixel with green intensity 54 goes in the first bin. The second pixel with green intensity 23 also goes in the first bin. The third pixel with green intensity 71 goes in the second bin. The fourth pixel with green intensity 167 goes in the third bin. Nothing goes in the fourth bin. 0 to 63 64 to 127 128 to 191 192 to 255 2 1 1Step by Step Solution
There are 3 Steps involved in it
Step: 1

Get Instant Access to Expert-Tailored Solutions
See step-by-step solutions with expert insights and AI powered tools for academic success
Step: 2

Step: 3
Ace Your Homework with AI
Get the answers you need in no time with our AI-driven, step-by-step assistance
Get Started
SQL For Data Science Data Cleaning Wrangling And Analytics With Relational Databases
Authors: Antonio Badia
1st Edition
3030575918, 978-3030575915