IN PYTHON PLEASE!
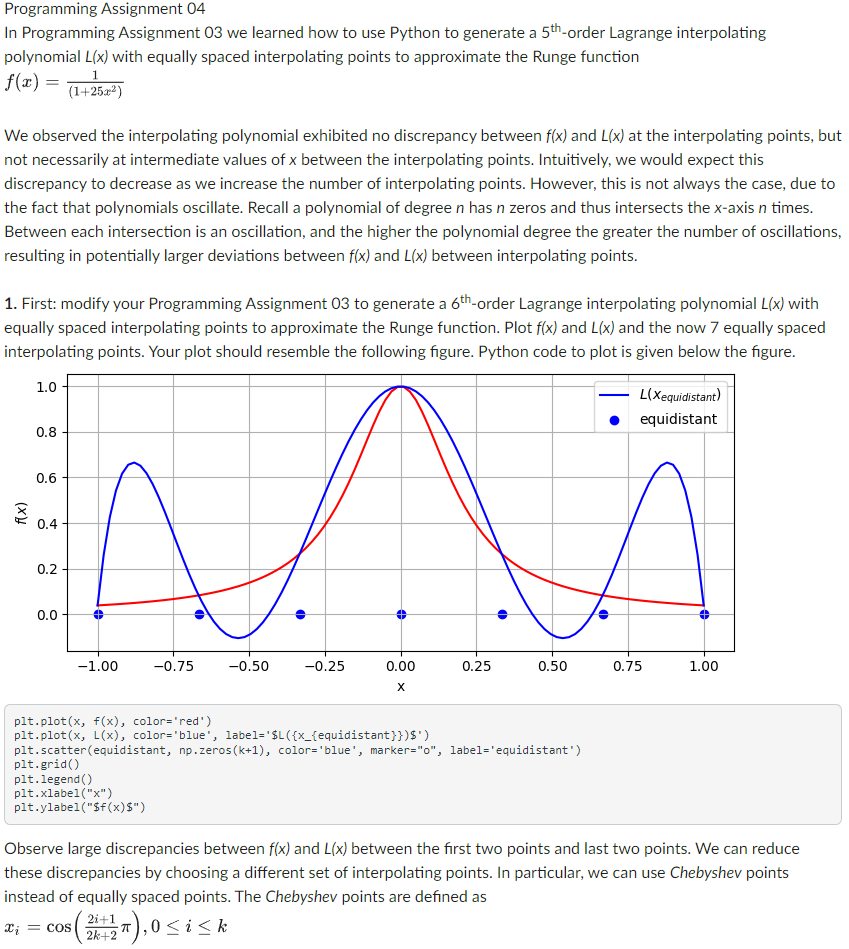
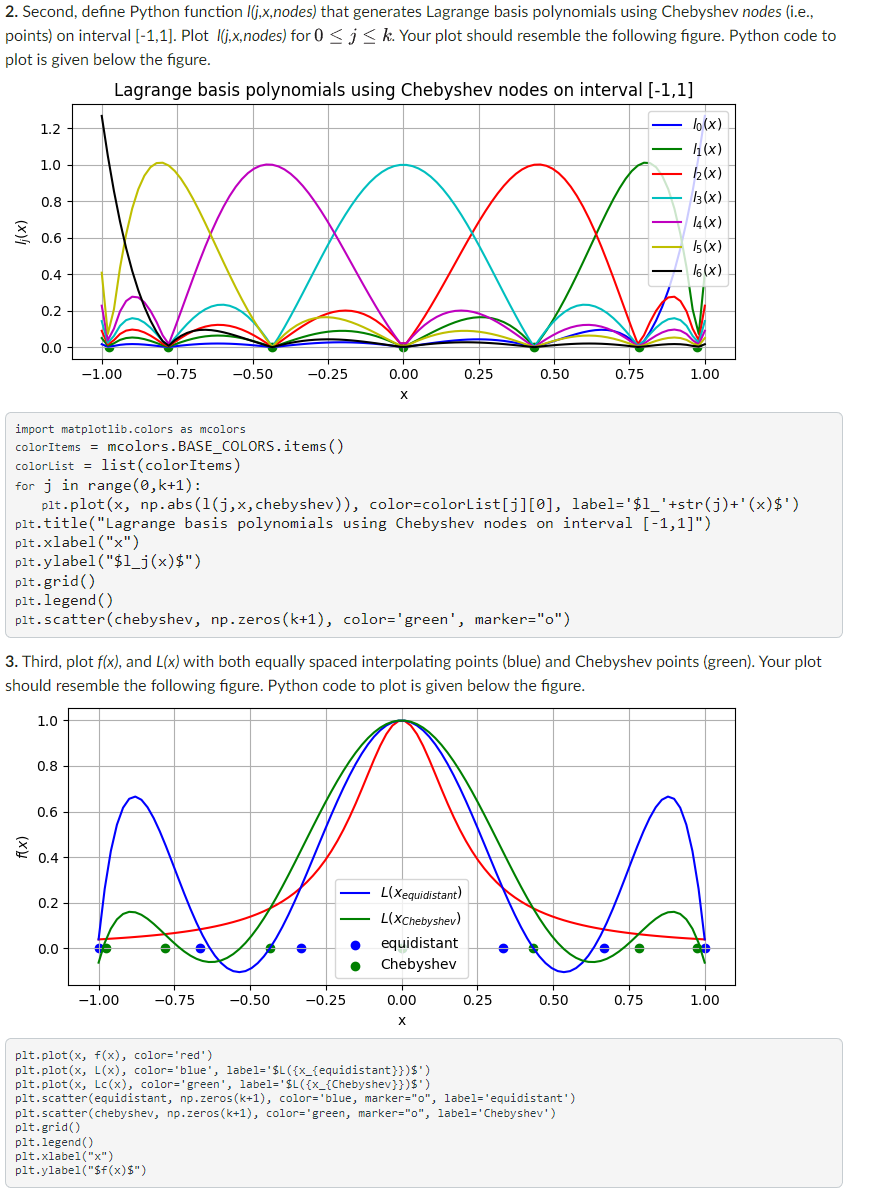
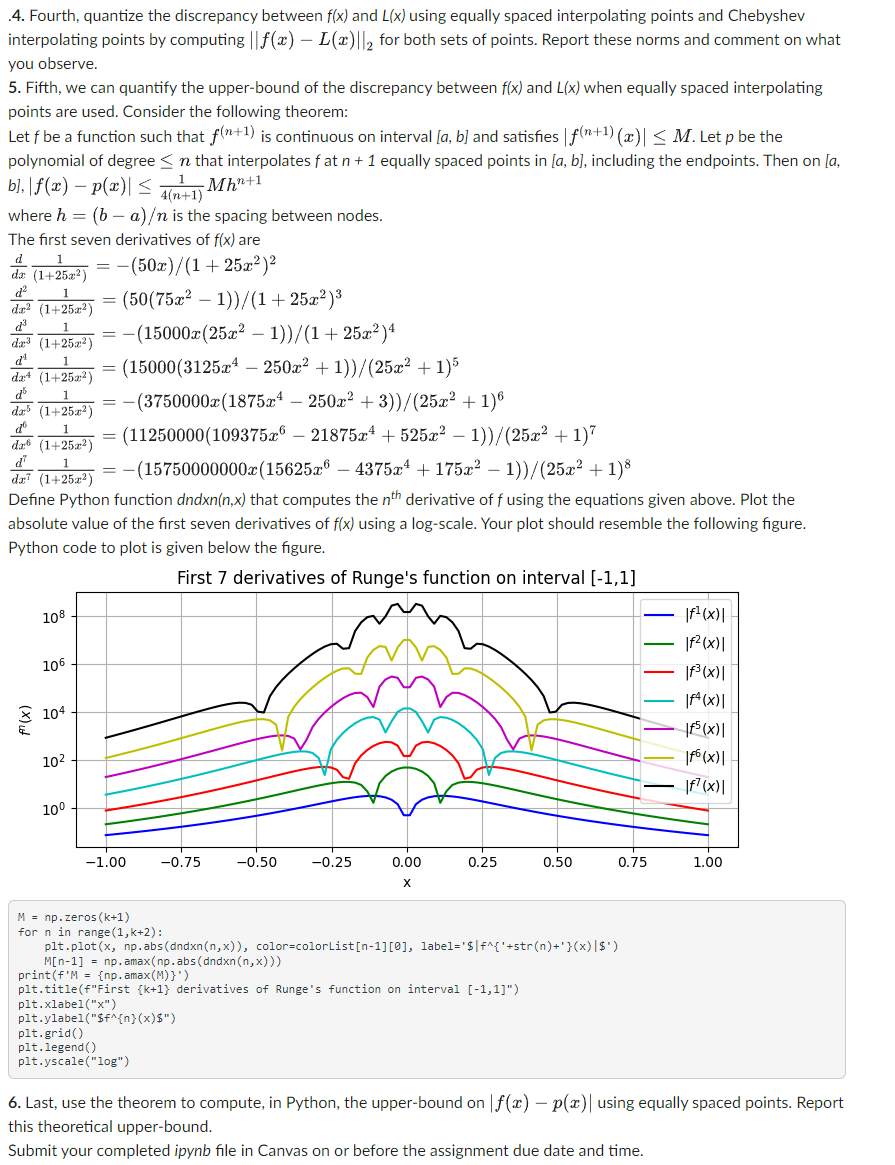
Programming Assignment 04 In Programming Assignment 03 we learned how to use Python to generate a 5th-order Lagrange interpolating polynomial L(x) with equally spaced interpolating points to approximate the Runge function f(x)=(1+25x2)1 We observed the interpolating polynomial exhibited no discrepancy between f(x) and L(x) at the interpolating points, bu not necessarily at intermediate values of x between the interpolating points. Intuitively, we would expect this discrepancy to decrease as we increase the number of interpolating points. However, this is not always the case, due to the fact that polynomials oscillate. Recall a polynomial of degree n has n zeros and thus intersects the x-axis n times. Between each intersection is an oscillation, and the higher the polynomial degree the greater the number of oscillation: resulting in potentially larger deviations between f(x) and L(x) between interpolating points. 1. First: modify your Programming Assignment 03 to generate a 6th-order Lagrange interpolating polynomial L(x) with equally spaced interpolating points to approximate the Runge function. Plot f(x) and L(x) and the now 7 equally spaced interpolating points. Your plot should resemble the following figure. Python code to plot is given below the figure. plt.plot (x,f(x), color='red') plt.plot (x,L(x), color='blue', label=' $L({x_{equidistant}})$) plt.scatter ( equidistant, np.zeros(k+1), color='blue', marker="o", label='equidistant") plt.grid() plt.legend () plt.xlabel(" x") plt.ylabel(" $(x)\( \$(x) \$ ") \)quot;) Observe large discrepancies between f(x) and L(x) between the first two points and last two points. We can reduce these discrepancies by choosing a different set of interpolating points. In particular, we can use Chebyshev points instead of equally spaced points. The Chebyshev points are defined as xi=cos(2k+22i+1),0ik 2. Second, define Python function I(j,x, nodes) that generates Lagrange basis polynomials using Chebyshev nodes (i.e., points) on interval [1,1]. Plot I(j,x, nodes) for 0jk. Your plot should resemble the following figure. Python code to plot is given below the figure. 3. Third, plot f(x), and L(x) with both equally spaced interpolating points (blue) and Chebyshev points (green). Your plot should resemble the following figure. Python code to plot is given below the figure. .4. Fourth, quantize the discrepancy between f(x) and L(x) using equally spaced interpolating points and Chebyshev interpolating points by computing f(x)L(x)2 for both sets of points. Report these norms and comment on what you observe. 5. Fifth, we can quantify the upper-bound of the discrepancy between f(x) and L(x) when equally spaced interpolating points are used. Consider the following theorem: Let f be a function such that f(n+1) is continuous on interval [a,b] and satisfies f(n+1)(x)M. Let p be the polynomial of degree n that interpolates f at n+1 equally spaced points in [a,b], including the endpoints. Then on [a, b], f(x)p(x)4(n+1)1Mhn+1 where h=(ba) is the spacing between nodes. The first seven derivatives of f(x) are dxd(1+25x2)1=(50x)/(1+25x2)2dx2d2(1+25x2)1=(50(75x21))/(1+25x2)3dx3d3(1+25x2)1=(15000x(25x21))/(1+25x2)4dx4d4(1+25x2)1=(15000(3125x4250x2+1))/(25x2+1)5dx5d5(1+25x2)1=(3750000x(1875x4250x2+3))/(25x2+1)6dx6d6(1+25x2)1=(11250000(109375x621875x4+525x21))/(25x2+1)7dx7d7(1+25x2)1=(15750000000x(15625x64375x4+175x21))/(25x2+1)8 Define Python function dndxn(n,x) that computes the nth derivative of f using the equations given above. Plot the absolute value of the first seven derivatives of f(x) using a log-scale. Your plot should resemble the following figure. Python code to plot is given below the figure. M=np.zeros(k+1) for n in range (1,k+2): plt.plot (x,np.abs(dndxn(n,x)), color=colorList [n1][0], label=' $f{+5tr(n)+}(x)$) M[n1]=np.amax(np.abs(dndxn(n,x))) print (fM={np.amax(M)}) plt.title(f"First {k+1} derivatives of Runge's function on interval [1,1]) plt. xlabel("x) plt.ylabel(" $f{n}(x)\( \left.\$ f^{\wedge}\{n\}(x) \$ " ight) \)quot;) plt.grid() plt.legend() plt.yscale("log") 6. Last, use the theorem to compute, in Python, the upper-bound on f(x)p(x) using equally spaced points. Report this theoretical upper-bound. Submit your completed ipynb file in Canvas on or before the assignment due date and time