Answered step by step
Verified Expert Solution
Question
1 Approved Answer
In Python. Will add the FBI_CrimeData_2016.json file. CPS141 Basic Data Science with Visualization Final Project Overview: This final project is a basic data science project
In Python. Will add the FBI_CrimeData_2016.json file.
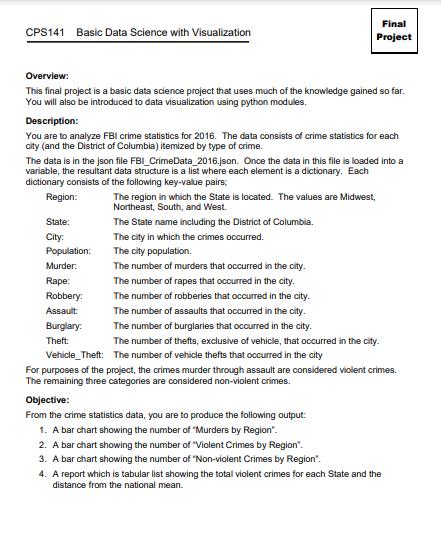
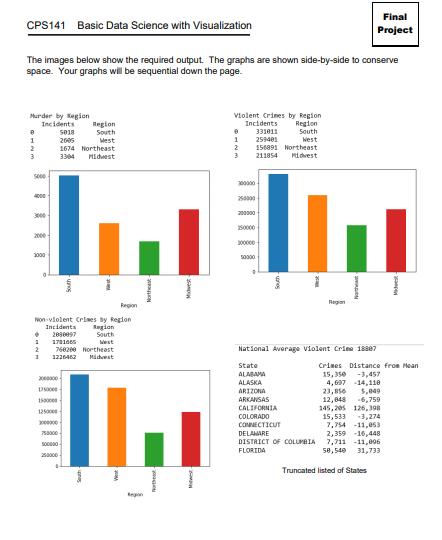
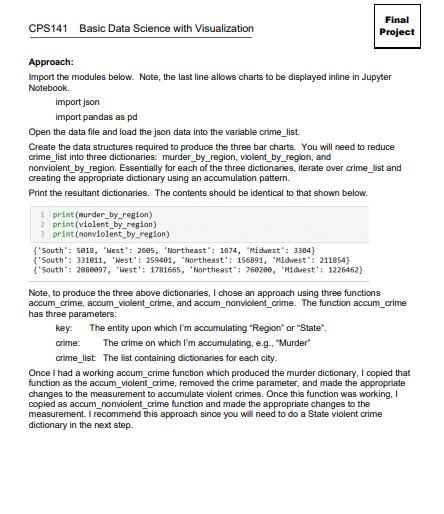
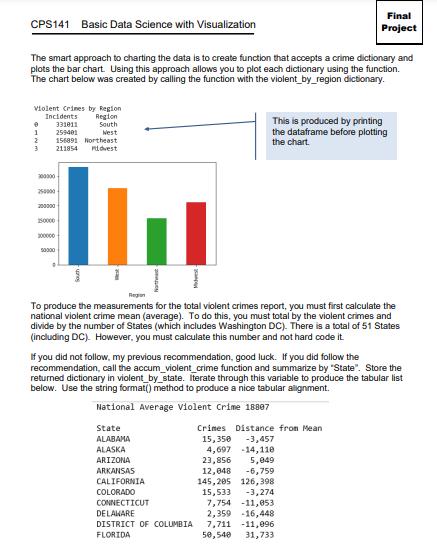
CPS141 Basic Data Science with Visualization Final Project Overview: This final project is a basic data science project that uses much of the knowledge gained so far. You will also be introduced to data visualization using python modules. Description: You are to analyze FBI crime statistics for 2016. The data consists of crime statistics for each city (and the District of Columbia) itemized by type of crime. The data is in the json file FBI CrimeData_2016.json. Once the data in this file is loaded into a variable, the resultant data structure is a list where each element is a dictionary. Each dictionary consists of the following key-value pairs; Region: State: City: Population: Murder: Rape: Robbery: Assault: Burglary: Theft: The region in which the State is located. The values are Midwest, Northeast, South, and West. The State name including the District of Columbia. The city in which the crimes occurred. The city population. The number of murders that occurred in the city. The number of rapes that occurred in the city. The number of robberies that occurred in the city. The number of assaults that occurred in the city. The number of burglaries that occurred in the city. The number of thefts, exclusive of vehicle, that occurred in the city. Vehicle_Theft: The number of vehicle thefts that occurred in the city For purposes of the project, the crimes murder through assault are considered violent crimes. The remaining three categories are considered non-violent crimes. Objective: From the crime statistics data, you are to produce the following output: 1. A bar chart showing the number of "Murders by Region". 2. A bar chart showing the number of "Violent Crimes by Region". 3. A bar chart showing the number of "Non-violent Crimes by Region". 4. A report which is tabular list showing the total violent crimes for each State and the distance from the national mean.
Step by Step Solution
★★★★★
3.39 Rating (152 Votes )
There are 3 Steps involved in it
Step: 1

Get Instant Access to Expert-Tailored Solutions
See step-by-step solutions with expert insights and AI powered tools for academic success
Step: 2

Step: 3

Ace Your Homework with AI
Get the answers you need in no time with our AI-driven, step-by-step assistance
Get Started


