In Python3:
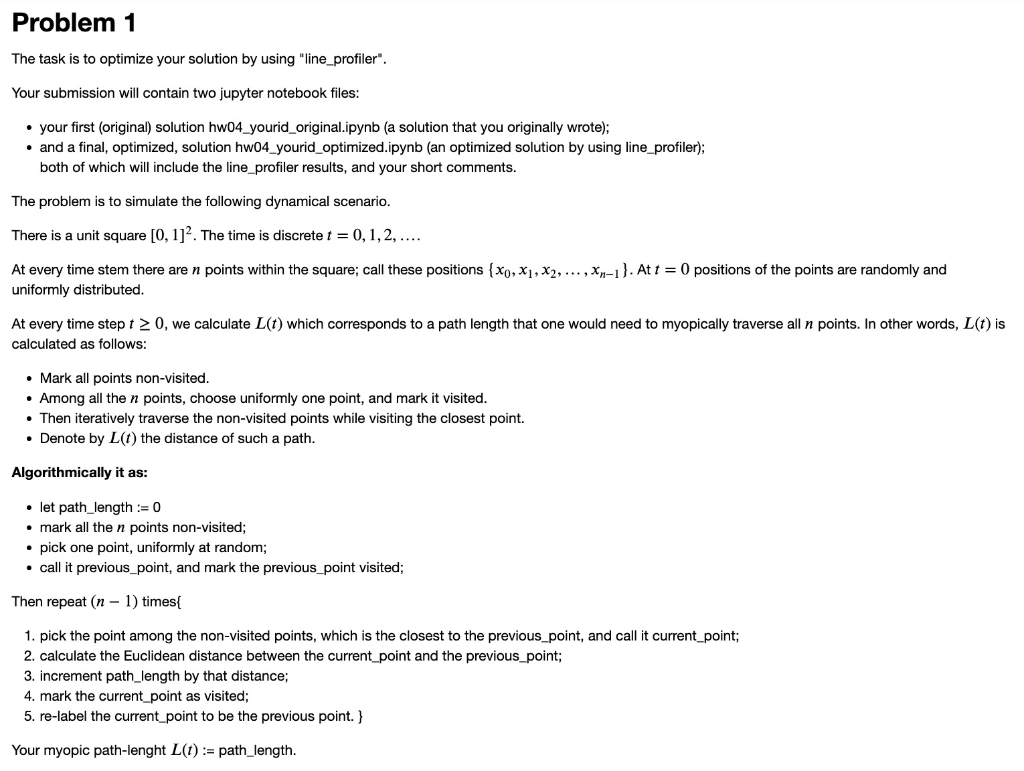
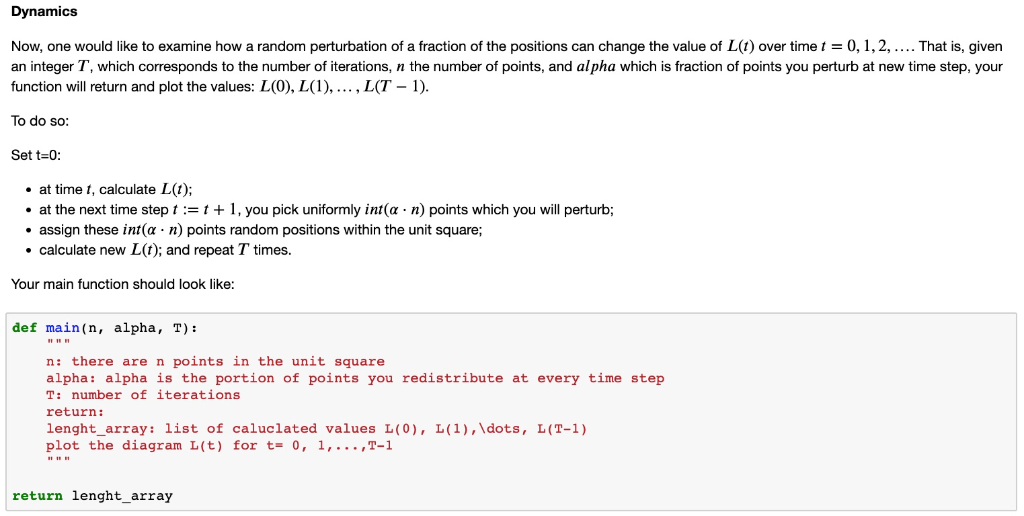
Problem 1 The task is to optimize your solution by using "line_profiler". Your submission will contain two jupyter notebook files: your first (original) solution hw04 yourid_original.ipynb (a solution that you originally wrote); . and a final, optimized, solution hw04 yourid_optimized.ipynb (an optimized solution by using line profiler) both of which will include the line_profiler results, and your short comments. The problem is to simulate the following dynamical scenario There is a unit square [0, 1]2. The time is discrete t -0,1,2,.... At every time stem there are n points within the square; call these positions {x0, X1, X2, , Xn-l }. At = 0 positions of the points are randomly and uniformly distributed At every time step t 2 0, we calculate L(t) which corresponds to a path length that one would need to myopically traverse all n points. In other words, L(t) is calculated as follows: Mark all points non-visited . Among all the n points, choose uniformly one point, and mark it visited . Then iteratively traverse the non-visited points while visiting the closest point. Denote by L(t) the distance of such a path. Algorithmically it as . let path length0 mark all the n points non-visited; pick one point, uniformly at random; call it previous_point, and mark the previous point visited; Then repeat (n - 1) times 1. pick the point among the non-visited points, which is the closest to the previous point, and call it current point; 2. calculate the Euclidean distance between the current_point and the previous_point; 3. increment path_length by that distance; 4. mark the current point as visited; 5. re-label the current _point to be the previous point. ) Your myopic path-lenght L(t):- path_length. Dynamics Now, one would like to examine how a random perturbation of a fraction of the positions can change the value of L(t) over time t = 0, 1, 2, That is, given an integer T, which corresponds to the number of iterations, n the number of points, and alpha which is fraction of points you perturb at new time step, your function will return and plot the values: L(0), L(1),... , L(T - 1) To do so: Set t-0: at time t, calculate L(t); at the next time step t:1, you pick uniformly int(a n) points which you will perturb; assign these int(a n) points random positions within the unit square; calculate new L(t); and repeat T times. Your main function should look like def main (n, alpha, T): n: there are n points in the unit square alpha: alpha is the portion of points you redistribute at every time step T: numbe return: lenght-array: list of caluciated values L(0), L(1), \dots, L(T-1) plot the diagram L(t) for t= 0, 1, ,7-1 r of iterations return lenght_array Problem 1 The task is to optimize your solution by using "line_profiler". Your submission will contain two jupyter notebook files: your first (original) solution hw04 yourid_original.ipynb (a solution that you originally wrote); . and a final, optimized, solution hw04 yourid_optimized.ipynb (an optimized solution by using line profiler) both of which will include the line_profiler results, and your short comments. The problem is to simulate the following dynamical scenario There is a unit square [0, 1]2. The time is discrete t -0,1,2,.... At every time stem there are n points within the square; call these positions {x0, X1, X2, , Xn-l }. At = 0 positions of the points are randomly and uniformly distributed At every time step t 2 0, we calculate L(t) which corresponds to a path length that one would need to myopically traverse all n points. In other words, L(t) is calculated as follows: Mark all points non-visited . Among all the n points, choose uniformly one point, and mark it visited . Then iteratively traverse the non-visited points while visiting the closest point. Denote by L(t) the distance of such a path. Algorithmically it as . let path length0 mark all the n points non-visited; pick one point, uniformly at random; call it previous_point, and mark the previous point visited; Then repeat (n - 1) times 1. pick the point among the non-visited points, which is the closest to the previous point, and call it current point; 2. calculate the Euclidean distance between the current_point and the previous_point; 3. increment path_length by that distance; 4. mark the current point as visited; 5. re-label the current _point to be the previous point. ) Your myopic path-lenght L(t):- path_length. Dynamics Now, one would like to examine how a random perturbation of a fraction of the positions can change the value of L(t) over time t = 0, 1, 2, That is, given an integer T, which corresponds to the number of iterations, n the number of points, and alpha which is fraction of points you perturb at new time step, your function will return and plot the values: L(0), L(1),... , L(T - 1) To do so: Set t-0: at time t, calculate L(t); at the next time step t:1, you pick uniformly int(a n) points which you will perturb; assign these int(a n) points random positions within the unit square; calculate new L(t); and repeat T times. Your main function should look like def main (n, alpha, T): n: there are n points in the unit square alpha: alpha is the portion of points you redistribute at every time step T: numbe return: lenght-array: list of caluciated values L(0), L(1), \dots, L(T-1) plot the diagram L(t) for t= 0, 1, ,7-1 r of iterations return lenght_array